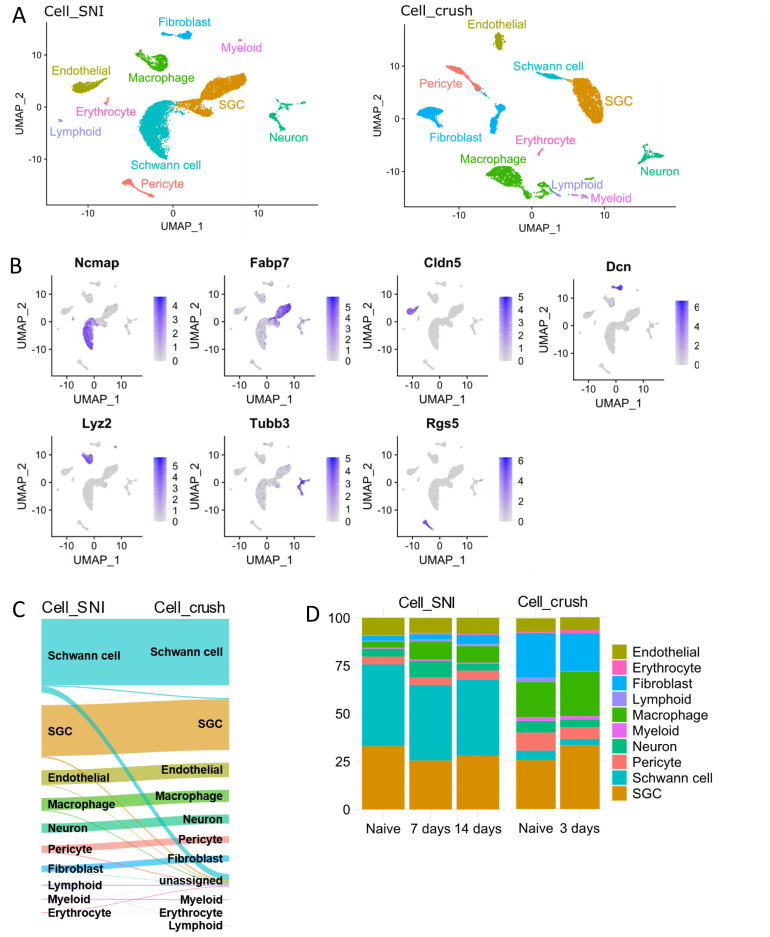
Figure 1. SGCs are easily identifiable in the Cell_SNI and Cell_crush datasets.
A) UMAPs of the Cell_SNI and Cell_crush datasets highlighting the identified cell types. B) UMAPs of the Cell_SNI dataset highlighting gene expression used to identify the cell types. Ncmap = Schwann cells, Fabp7 = SGCs, Cldn5 = endothelials, Dcn = fibroblasts, Lyz2 = macrophages, Tubb3 = neurons, Rgs5 = pericytes. C) Sanky diagram showing the projection of the Cell_SNI dataset on to the Cell_crush dataset. D) The percentage distribution of the cell types in the dataset. Cell_SNI naïve = 3486 cells, Cell_SNI 7 days = 3029 cells, Cell_SNI 14 days = 4386 cells, Cell_crush naïve = 3090 cells, Cell_crush 3 days = 3748 cells

