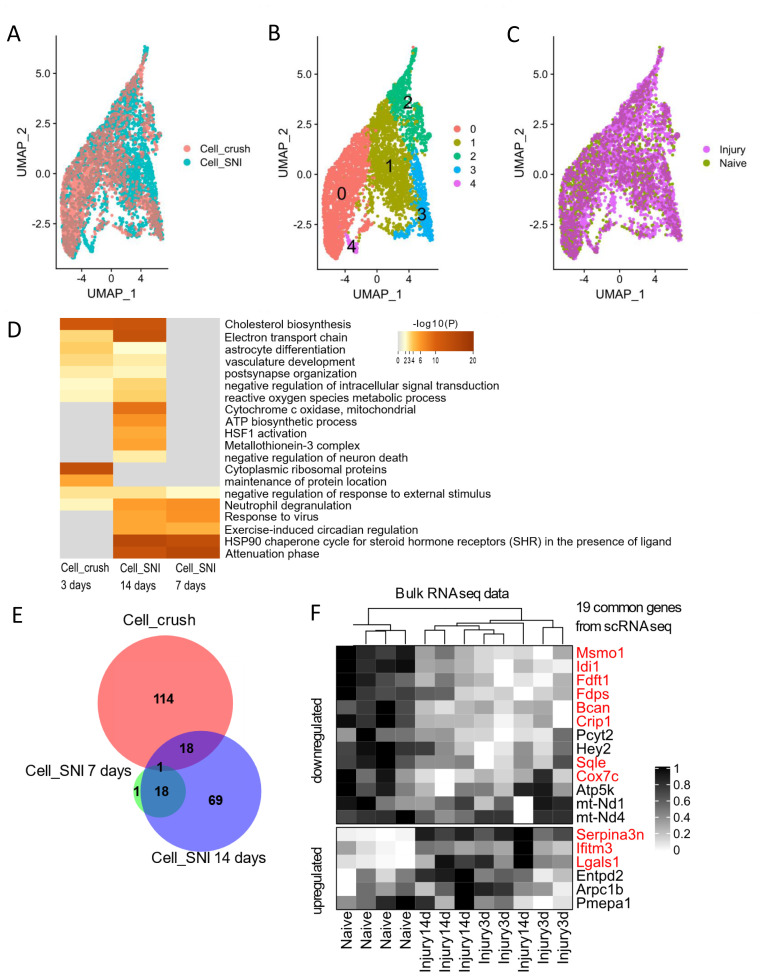
Figure 2. Common injury response of SGCs.
A– C) UMAPs of combined and integrated SGCs from the Cell_SNI (3153 cells) and Cell_crush (2147 cells) datasets. A) UMAP coloured based on dataset. B) UMAP coloured based on clustering. Each number/colour denotes a cluster. C) UMAP coloured based on injury condition with 3321 SGCs from injured condition and 1979 SGCs from uninjured condition. D) Heatmap of enriched gene annotation terms. The top 20 highest ranking terms are shown. E) Venn diagram of number of differentially expressed genes in SGCs in Cell_crush and Cell_SNI datasets when comparing injured states to naïve. F) Heatmap displaying expression levels from bulk RNAseq data (Jager et al) containing n=4 for per condition (naïve, 3 days and 14 days after injury). The genes extracted here are the 18+1 common genes between the Cell_SNI and Cell_crush datasets from Figure 2C. The genes marked in red are also differentially regulated in the displayed bulk RNAseq.

