
Figure 4. Glia cells change in culture.
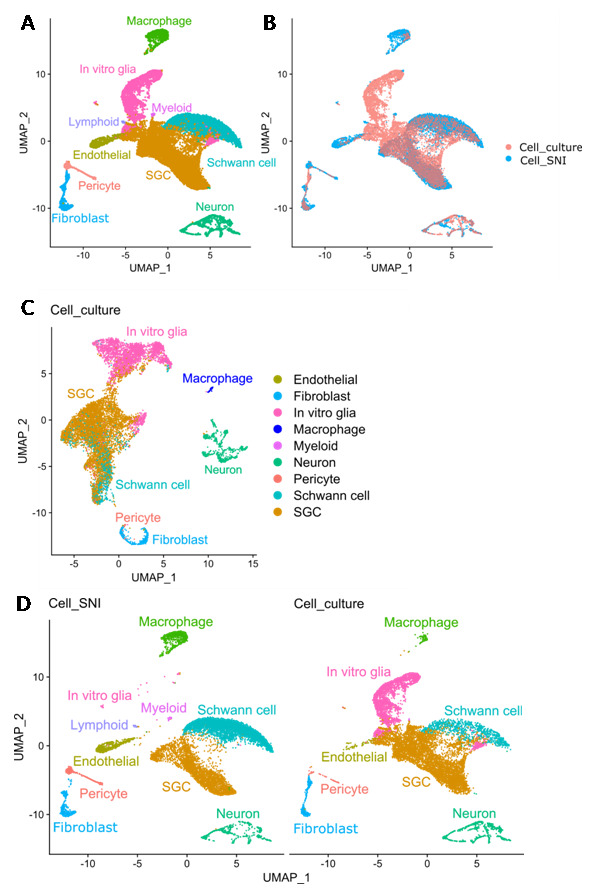
A) UMAP of joint analysis of the Cell_culture (10563 cells) and Cell_SNI (10901 cells) datasets with annotation of cell types. B) UMAP of joint analysis of the Cell_culture and Cell_SNI datasets coloured based on dataset. C) UMAP of Cell_culture dataset with annotation from joint analysis. D) UMAPs of the joint analysis split based on dataset origin (Cell_culture or Cell_SNI) with annotation of cell types identified from the joint analysis. E) Expression of markers for SGCs (Fabp7 and Kcnj10), cell proliferation (Top2a and Mki67) and Schwann cells (Ncmap, Bcas1 and Prx) in the joint analysis. F) Heat map showing the result of the SingleR analysis which compared the gene expression in the joint analysis (Cell_culture and Cell_SNI datasets) with cells in the developing peripheral nervous system. SCP = Schwann cell precursor.