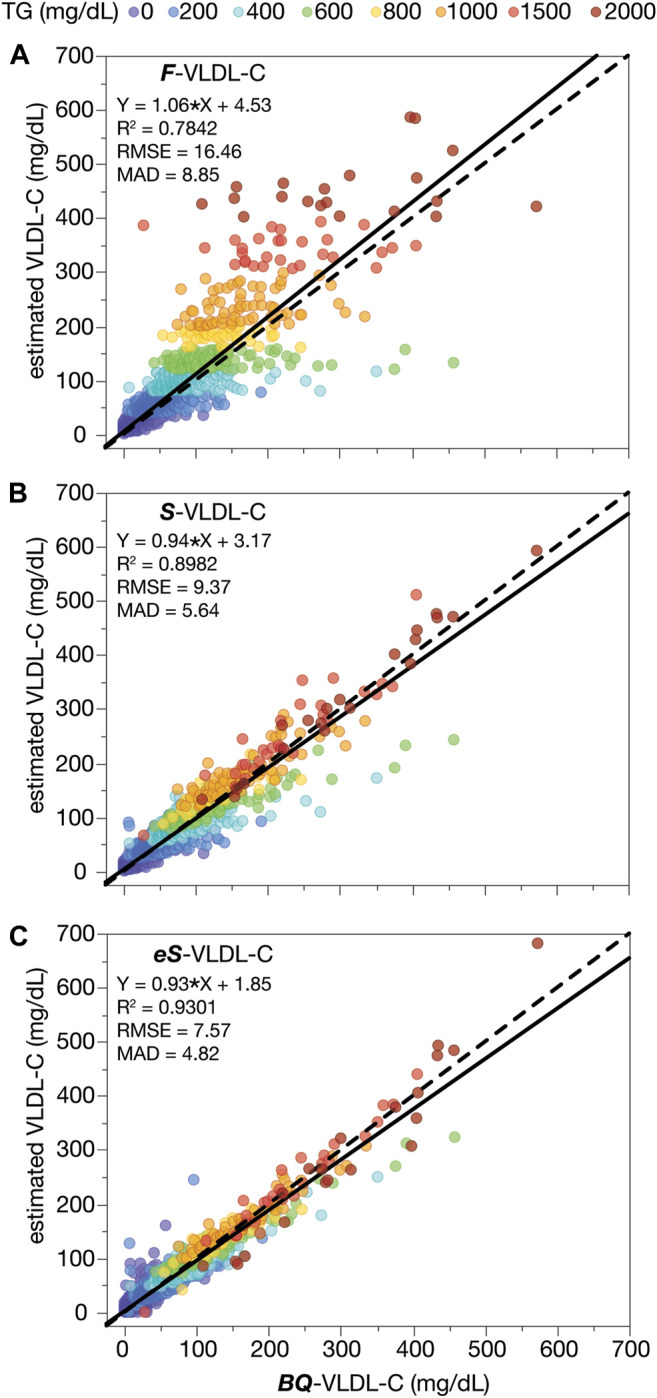
FIGURE 3.

VLDL-C by calculation versus β-quantification. VLDL-C was calculated from the results of a standard lipid panel in the validation dataset (N = 12,405) by the Friedewald VLDL-C formula (F-VLDL-C) (A), the Sampson VLDL-C equation (S-VLDL-C) (B), and the enhanced Sampson VLDL-C equation (eS-VLDL-C) (C) and plotted against VLDL-C as measured by BQ. Solid lines are the linear fit for indicated regression equations. Dashed lines are the line of identity. Results are color-coded by TG levels with the value in the legend indicating the start of each interval.
