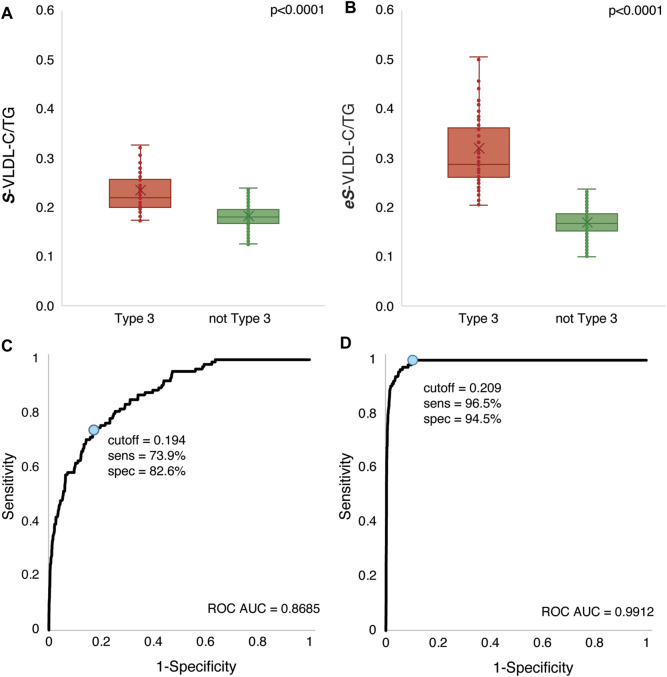
FIGURE 4.
VLDL-C/TG ratio comparison in HLP3 and non-HLP3 patients. VLDL-C was calculated by the Sampson VLDL-C/TG (S-VLDL-C/T) (A) and enhanced Sampson VLDL-C/TG (eS-VLDL-C/T) (B) equations in the validation dataset (N = 12,405) from the results of a standard lipid panel. HLP3 was defined as VLDL-C/TG > 0.3 mg/dl and TG between 150–1,000 mg/dl using the BQ results. The ROC curves are plotted for the Sampson VLDL-C/TG (S-VLDL-C/T) (C) and enhanced Sampson VLDL-C/TG (eS-VLDL-C/T) (D) equations. The optimal cut-point (blue circle) and its corresponding sensitivity and specificity are indicated for each equation.

