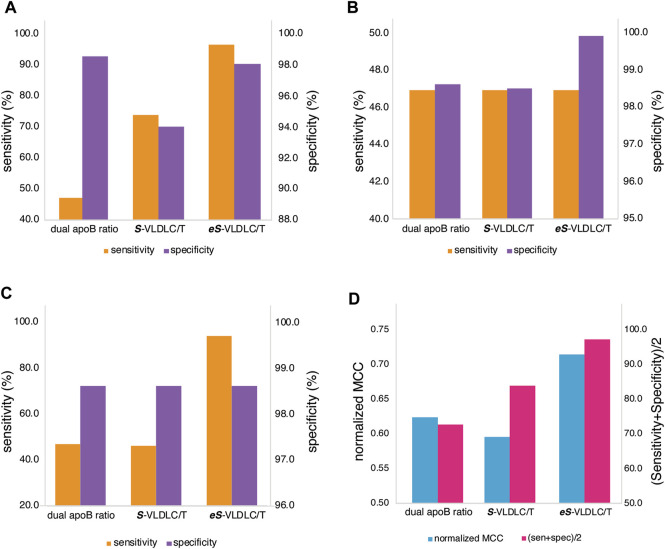
FIGURE 5.
Comparison of test accuracy for HLP3 classification. Classification accuracy in the validation dataset (N = 12,405) by sensitivity (orange) and specificity (purple) for the dual apoB ratio method, the Sampson VLDL-C/TG (S-VLDL-C/T), and enhanced Sampson VLDL-C/TG (eS-VLDL-C/T) methods are shown for the optimal cut-points (A), after adjustment to match the dual apoB ratio sensitivity (B), and after adjustment to match the dual apoB ratio specificity (C). The normalized MCC score (blue) and the average of sensitivity and specificity (sen + spec/2; pink) are shown for the optimal cut-points (D).

