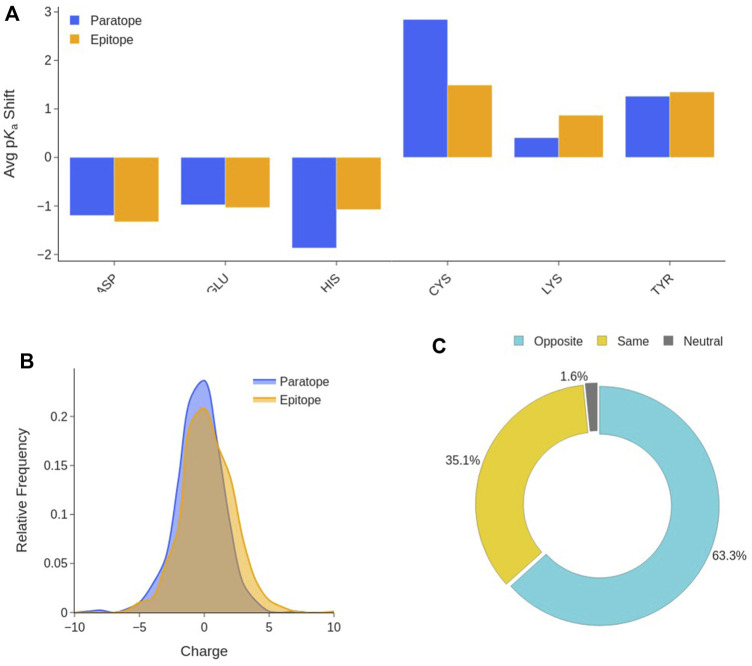
FIGURE 7.
Interface titratable residues characterization. (A) Average pK a shift of titratable residues at the Ab-Ag interface with respect to their value in water. (B) Distribution of the net charge in the paratope and epitope at pH 7.2. (C) Ab-Ag interface charge complementary composition. Distinctions are made among interfaces in which paratope and epitope have the same charge, opposite charges, and when one partner is neutral.

