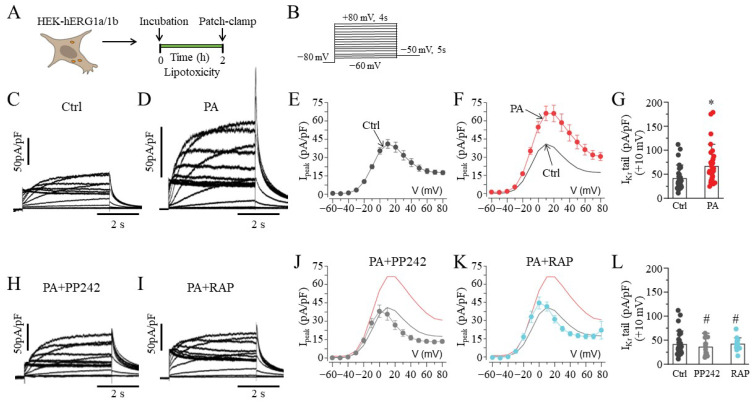
Figure 1.
Electrophysiology of hERG1a/1b currents in lipotoxic HEK293 cells. (A) Experimental protocol: Macroscopic hERG1a/1b currents measured in HEK293 cells under control conditions and after pre-exposure to lipotoxicity for 2 h. (B) Voltage protocols used for evoking hERG1a/1b currents. Exemplar hERG1a/1b currents measured in control (C) and lipotoxic HEK293 cells (D). (E–G), Population Ipeak–V curves for hERG1a/1b currents and averaged data measured at +10 mV under the indicated conditions. Arrows indicate pooled 1a/1b peak current in control and lipotoxic cells. (H–L), Representative traces, population Ipeak–V curves, and averaged data at +10 mV for currents measured in lipotoxic cells pre-exposed to PP242 ( , and grey line) and RAP (
 , and cyan line), with the same format as (C–G). The Ipeak–V curves for hERG1a/1b currents measured in control cells (black line) and in cells pre-treated with lipotoxicity (red line) are shown for comparison. Data are shown as the mean ±S.E.M. (* statistical significance at p < 0.05; # statistical non-significance at p > 0.05).

