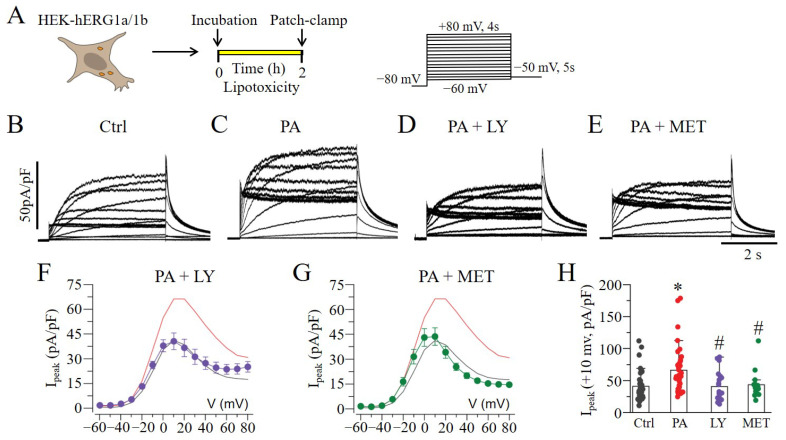
Figure 2.
The effect of mTOR signaling on hERG1a/1b currents. (A) Experimental protocol: Macroscopic hERG1a/1b currents measured in HEK293 cells under control conditions and 2 h after lipotoxicity exposure, using the illustrated voltage protocol. (B–E) Exemplar traces of currents measured in control and lipotoxic cells (PA) in the absence and presence of the PI3K–Akt inhibitor LY and AMPK activator MET. (F–H), Pooled Ipeak–V curves, and averaged peak current at +10 mV for 1a/1b measured in lipotoxic cells in the presence of LY ( , and purple line) and MET (
 , and green line). The Ipeak–V curves for hERG1a/1b currents measured in control cells (black line) and in cells pre-treated with lipotoxicity (red line) are shown for comparison. (* statistical significance at p < 0.05; # statistical non-significance at p > 0.05).

