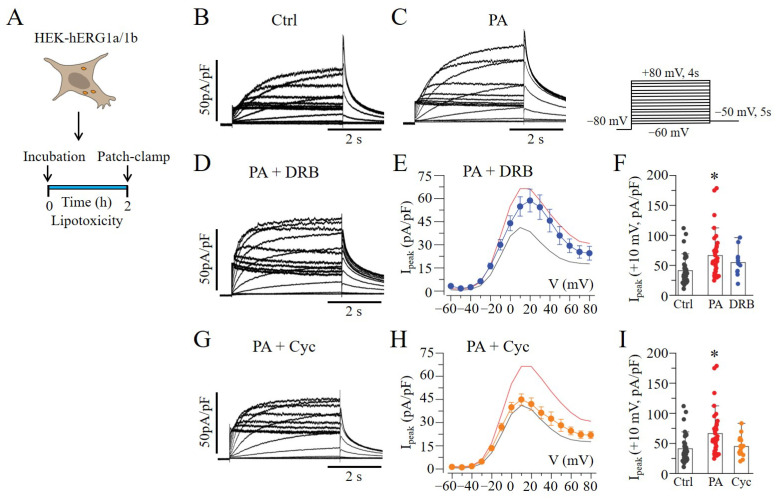
Figure 4.
Protein translation contributes to lipotoxicity-induced increase in hERG1a/1b. (A) Experimental protocol: macroscopic hERG1a/1b currents were measured in HEK293 cells under control conditions (B) and after pre-exposure to lipotoxicity (C) for 2 h, using the illustrated voltage protocol. (D–I) Exemplar traces, pooled Ipeak–V curves, and averaged current amplitude measured at +10 mV under the effects of DRB ( , and blue line) and Cyc (
 , and orange line). The Ipeak–V curves for hERG1a/1b currents measured in control cells (black line in (E,H)) and in cells pre-treated with lipotoxicity (red line in (E,H)) are shown for comparison. (* statistical significance at p < 0.05).

