
Figure 11.
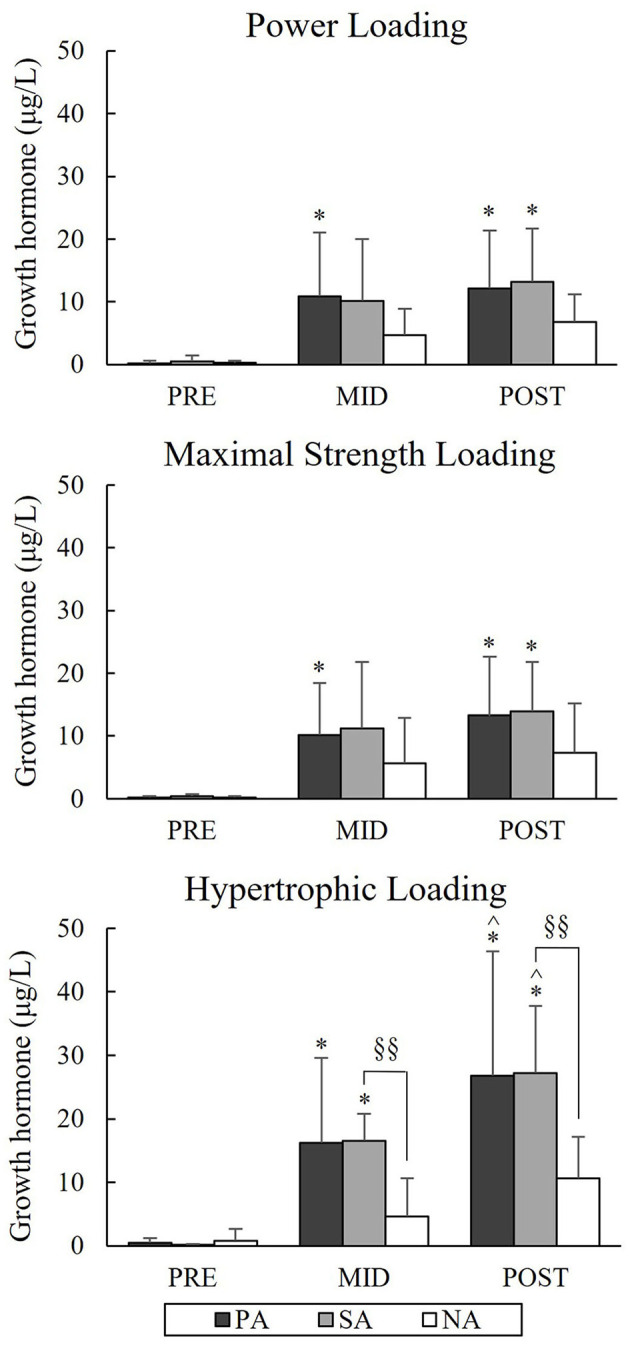
Serum growth hormone concentrations of Pre, Mid, and Post during three resistance exercise loadings in power (PA), strength (SA), and non-athletes (NA). *p < 0.05 refer to within-group significances compared to Pre. ∧p < 0.05 refer to within-group significances compared to Mid. §§p < 0.01 refer to between-group significances.