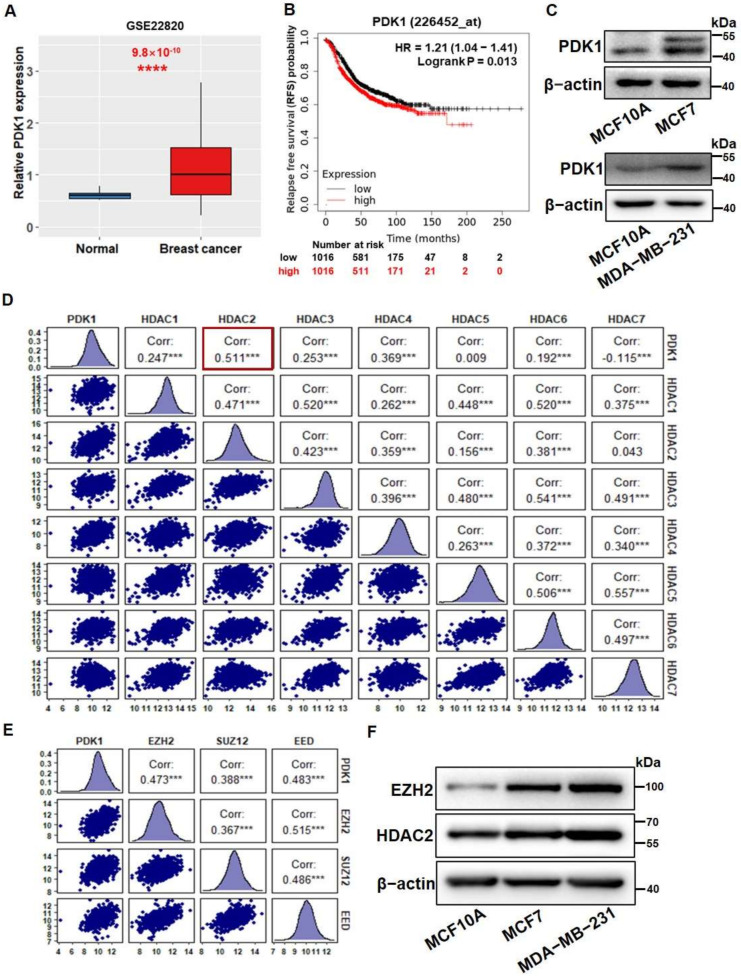
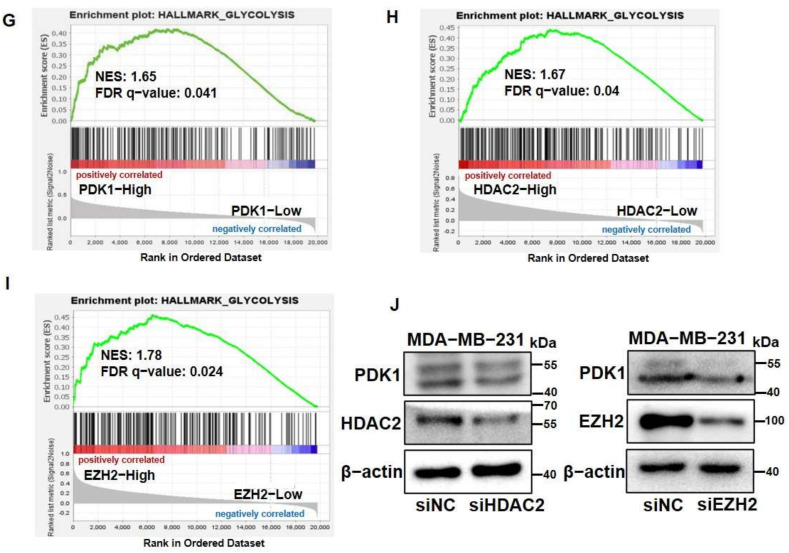
Figure 1.
PDK1 levels were upregulated by HDAC2 and EZH2, which are associated with glycolysis. (A) The expression levels of PDK1 were analyzed in normal and breast cancer tissues from GEO dataset (GSE22820). (B) The relapse-free survival time was analyzed in groups with high and low expression of PDK1. (C) The protein levels of PDK1 were detected by Western blotting in MCF10A, MCF7, and MDA-MB-231 breast cancer cell lines. (D) The Pearson’s correlation analysis was conducted to test the correlation between levels of PDK1 and HDACs, including HDAC1-7. The data distribution, correlation coefficients between genes, and statistical significance were shown; the most significant correlation is indicated with a red border. (E) The Pearson’s correlation analysis was used to verify the correlation between PDK1 and PRC2, including EZH2, SUZ12, and EED levels. (F) HDAC2 and EZH2 protein levels were detected by Western blotting (G–I). The GSEA program was employed to analyze HALLMARK_GLYCOLYSIS pathway enrichment scores between (G) PDK1 high- and low-expression groups, (H) HDAC2 high- and low-expression groups, and (I) EZH2 high- and low-expression groups in TCGA BRCA dataset. (J) The protein expression levels of PDK1 were measured by Western blotting in the MDA-MB-231 control group (siNC), HDAC2 silencing group (siHDAC2), and EZH2 silencing group (siEZH2). Using the median value as the grouping standard. *** Indicates significant difference at p < 0.001, **** indicates significant difference at p < 0.0001. Original Blots see Supplementary File S1.


