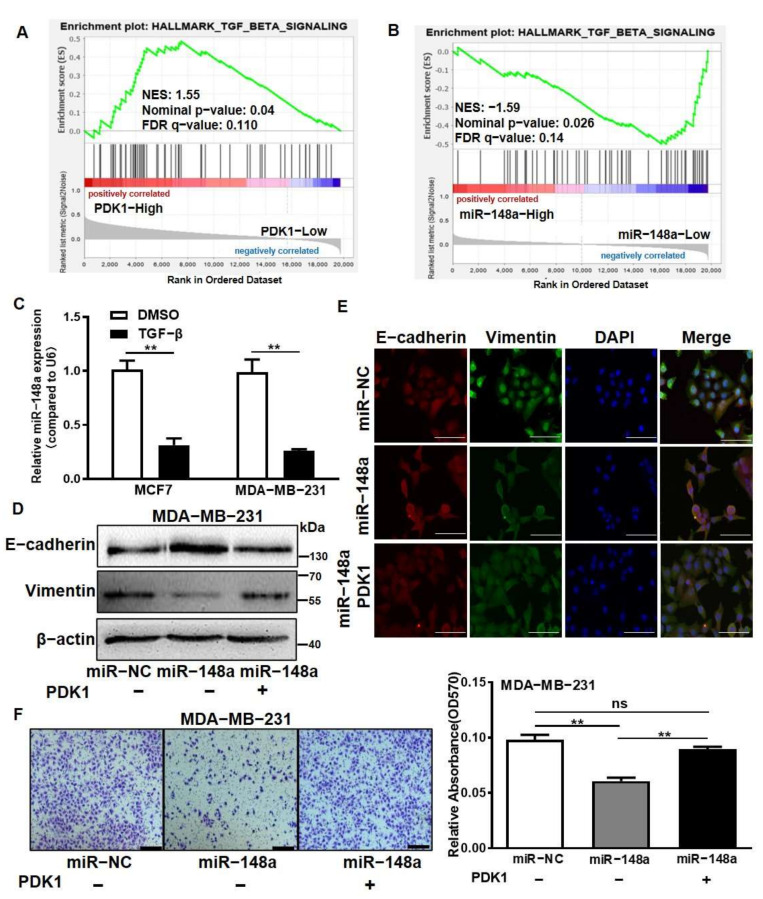
Figure 7.
PDK1 suppression by miR-148a inhibited epithelial–mesenchymal transition and cell migration. (A,B) The GSEA program was employed to analyze KALLMARK_TGF_BETA_SIGNALING pathway enrichment scores between PDK1 (A) and miR-148a (B) high- and low-expression groups using TCGA BRCA dataset. (C) TGF-β was used to treat MCF7 and MDA-MB-231 cells, and the expression levels of miR-148a were detected by qRT-PCR. (D) The protein levels of E-cadherin and Vimentin were measured in MDA-MB-231 miR-NC, miR-148a, and miR-148a + PDK1 groups by Western blotting. (E) Immunofluorescence assay (IF) was used to detect E-cadherin (red) and Vimentin (green) protein levels in MDA-MB-231 miR-NC, miR-148a, and miR-148a + PDK1 groups. Representative images (400×) are shown (bar = 50 μm). (F) The invasiveness abilities of MDA-MB-231 miR-NC, miR-148a, and miR-148a + PDK1 cells were assessed by Transwell assays. Representative images (200×) are shown (left). The numbers of invaded cells were quantified by detecting the relative absorbance of crystal violet at OD570. Three independent experiments were performed in (C–F). Student’s t-test was used for comparison between two groups in (C,F). ** Indicates significant difference at p < 0.01 and ns denotes no significance. Original Blots see Supplementary File S1.

