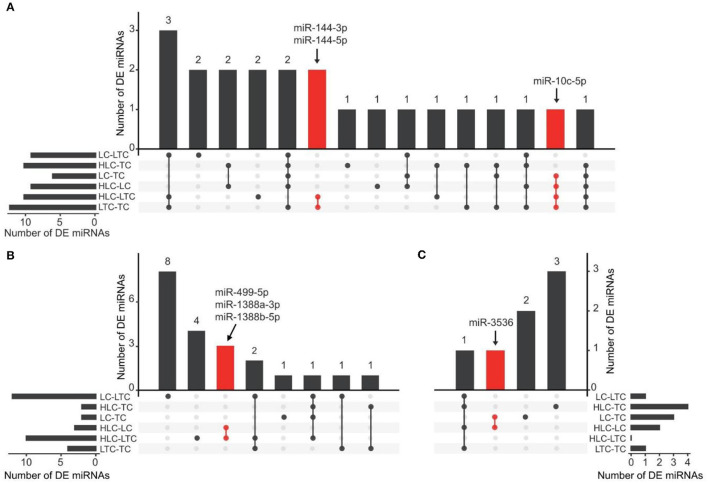
Figure 2.
UpSet plot showing the screening of candidate ENMs in the liver (A), lung (B), and heart (C). The bars on the left or right of each panel were the numbers of DE miRNAs in each comparison of two groups of chickens. The dots represent relative DE miRNAs detected in the corresponding comparison. For example, in (B), the red dots represent miRNAs detected to be differentially expressed in both two comparisons (HLC vs. LC, and HLC vs. LTC). Three and two candidate ENMs were obtained from the LC vs. HLC and LTC vs. TC comparisons, respectively.

