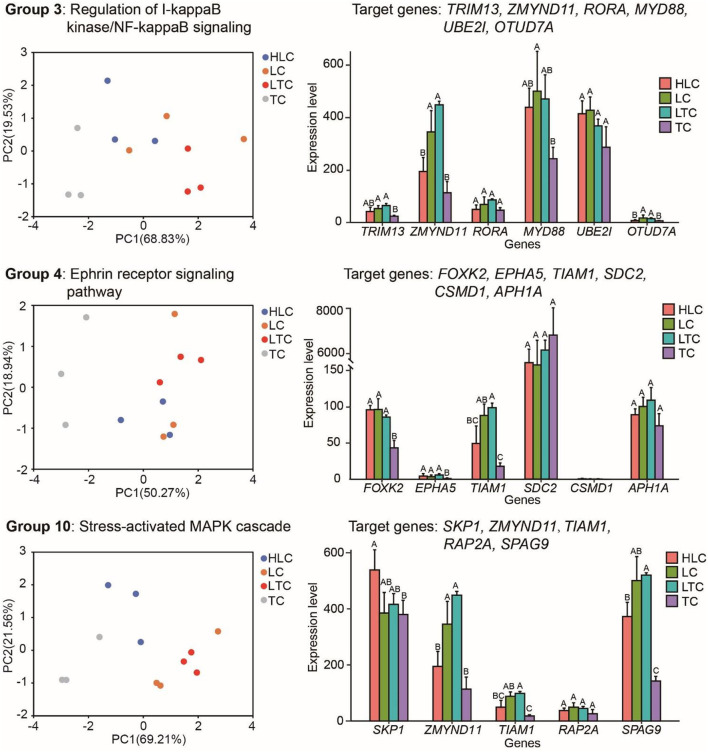
Figure 5.
Target genes of miR-10c-5p have different expression patterns between high and low-altitude chickens. The left, middle, and right panels represent the target genes of miR-10c-5p and the pathways these genes are involved in (left panels), PCA plots based on these target genes, and the expression of target genes of miR-10c-5p, respectively. Different letters mean that there is a statistically significant difference between groups (P ≤ 0.05).

