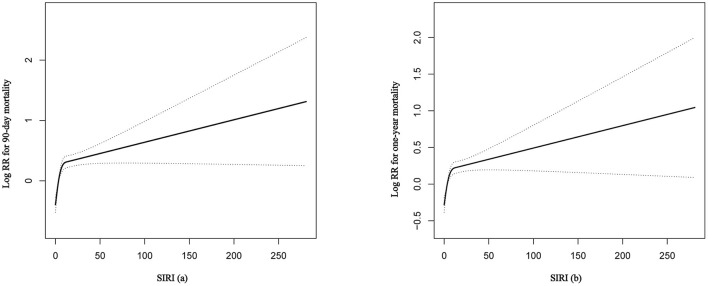
Figure 2.
The smooth curve fitting demonstrates the relationship between SIRI and the 90-day and 1-year all-cause mortality. The resulting figures show the predicted log (relative risk) in the y-axis and the continuous variables in the x-axis. RR, relative risk; SIRI, systemic inflammation response index.

