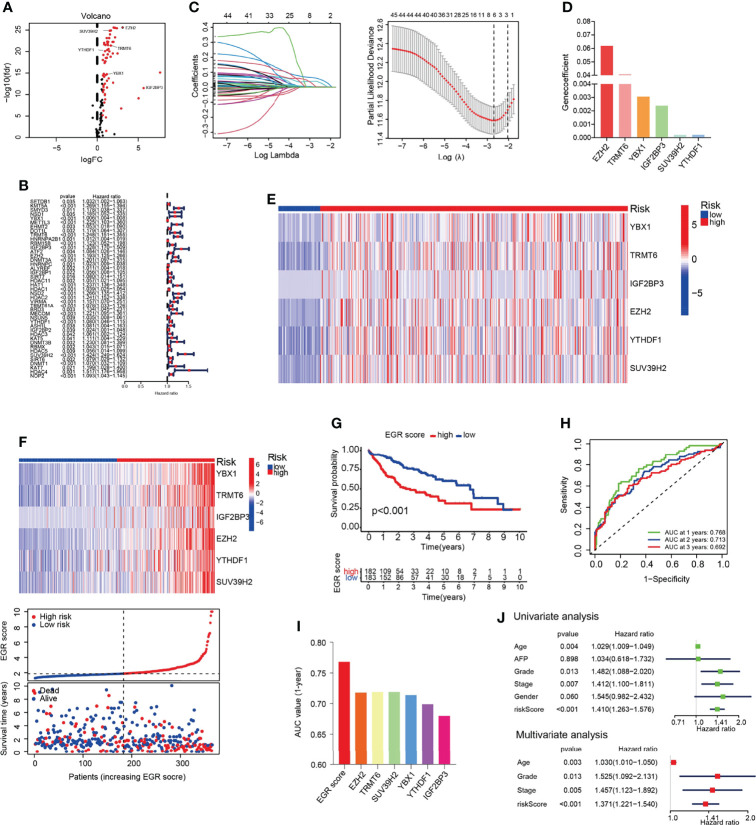
Figure 1.
Construction of EGR signature in the TCGA-LIHC cohort. (A) Volcano plot of the epigenetic regulators. (B) Univariate Cox analysis of the genes selected by DEGs. (C) Cross-validation for tuning the parameter selection in the LASSO regression. (D) The coefficients of the 6 OS-related genes. (E) Heatmap of genes consisted in EGR signature in normal and HCC patients. (F) Heatmap of genes consisted in EGR signature, the distribution of patients, and the survival status for each individual in low-risk and high-risk HCC patients. (G) Kaplan–Meier curves for the OS of patients between the high- and low-risk groups. (H) Time-dependent ROC curves demonstrated the predictive efficiency. (I) Area under the ROC curve of 1-year survival. (J) Univariate and multivariate Cox regression analyses for the EGRscore.

