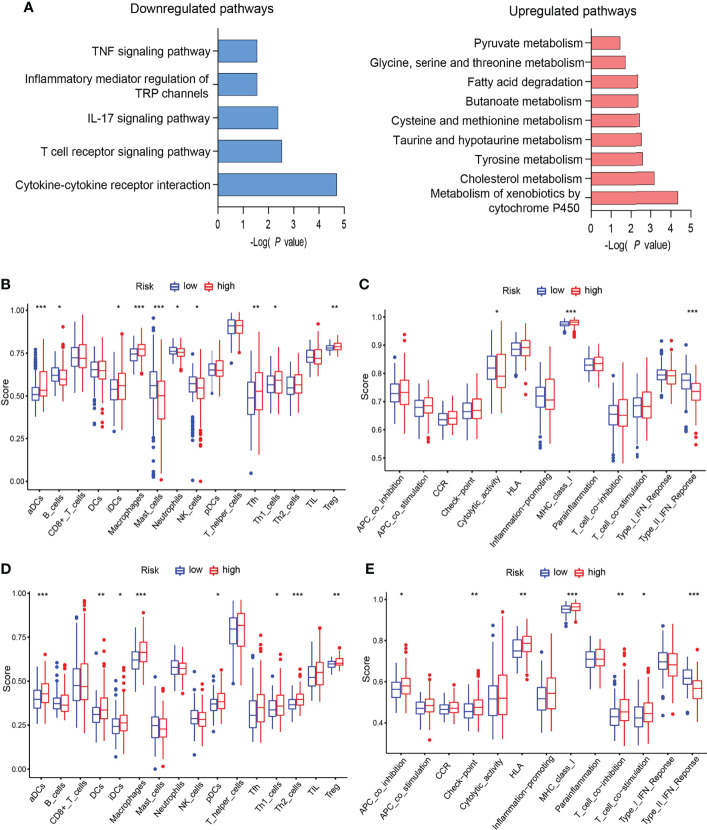
Figure 4.
EGRscore correlated with immune microenvironment. (A) KEGG of DMGs in the high- and low-risk groups in the TCGA-LIHC cohort. (B) Comparison of immune cell infiltration in the high- and low-risk groups in the TCGA-LIHC cohort. (C) Comparison of immune function in the high- and low-risk groups in the TCGA-LIHC cohort. (D) Comparison of immune cell infiltration in the high- and low-risk groups in the ICGC-JIHC cohort. (E) Comparison of immune function in the high- and low-risk groups in the ICGC-JIHC cohort. Statistical significance was denoted with *(p < 0.05), **(p < 0.01), and ***(p < 0.001).

