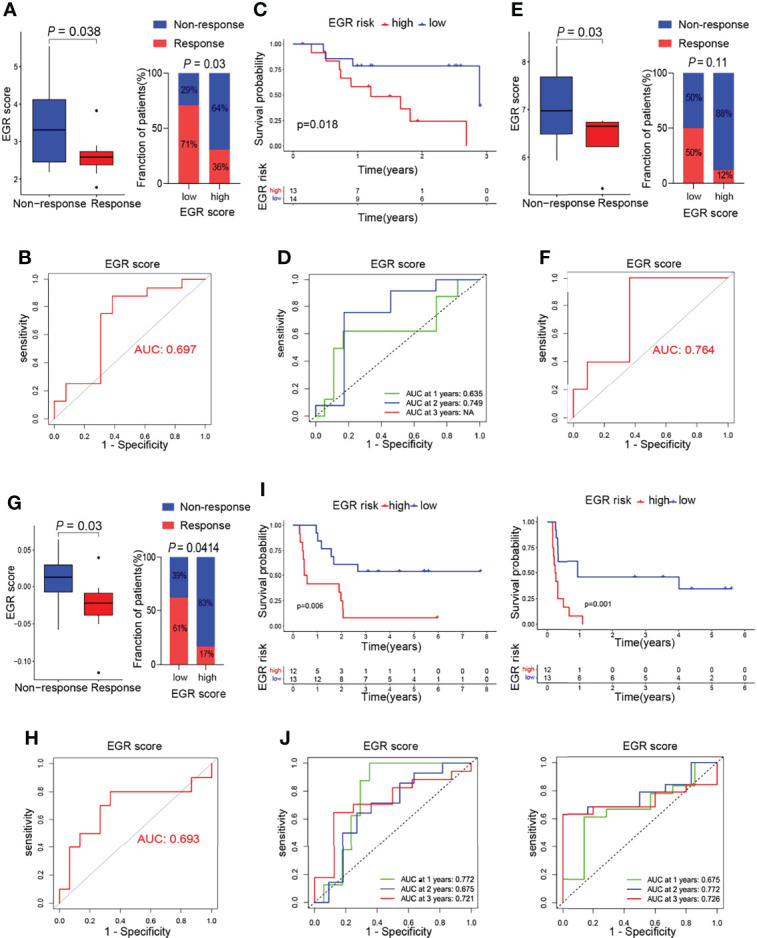
Figure 5.

Association of m6Ascore and response to immunotherapy. (A) Boxplot of response of immunotherapy between EGRscore-low and EGRscore-high HCC patients. (B) ROC curves based on EGRscore in the GSE78220 cohort. (C) Kaplan–Meier survival analysis based on EGRscore in the GSE78220 cohort. (D) Time-dependent ROC curves based on EGRscore in the GSE78220 cohort. (E) Boxplot of response of immunotherapy between EGRscore-low and EGRscore-high HCC patients in the GSE126044 cohort. (F) ROC curves based on EGRscore in the GSE126044 cohort. (G) Boxplot of response of immunotherapy between EGRscore-low and EGRscore-high HCC patients in the GSE100797 cohort. (H) ROC curves based on EGRscore in the GSE100797 cohort. (I) Kaplan–Meier survival analysis for OS and DFS based on EGRscore in the GSE100797 cohort. (J) Time-dependent ROC curves for OS and DFS based on EGRscore in the GSE100797 cohort.
