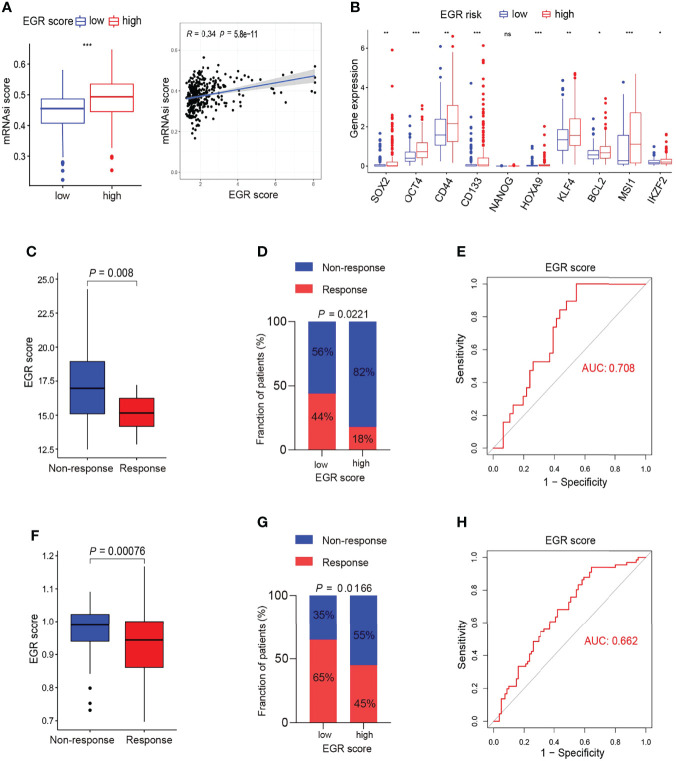
Figure 6.
Association of m6Ascore and response to chemotherapy. (A) Boxplot of stemness score between EGRscore-low and EGRscore-high HCC patients. (B) Boxplot of genes associated with stemness between EGRscore-low and EGRscore-high HCC patients. (C) Boxplot of response of chemotherapy between EGRscore-low and EGRscore-high HCC patients. (D) Proportion of EGRscore-high and EGRscore-low group in patients that harbored a response or not in the GSE109211 cohort. (E) ROC curves based on EGRscore in the GSE109211 cohort. (F) Boxplot of response of TACE between EGRscore-low and EGRscore-high HCC patients. (G) Proportion of EGRscore-high and EGRscore-low group in patients that harbored a response or not in the GSE104580 cohort. (H) ROC curves based on EGRscore in the GSE104580 cohort. Statistical significance was denoted with *(p < 0.05), **(p < 0.01), and ***(p < 0.001).

