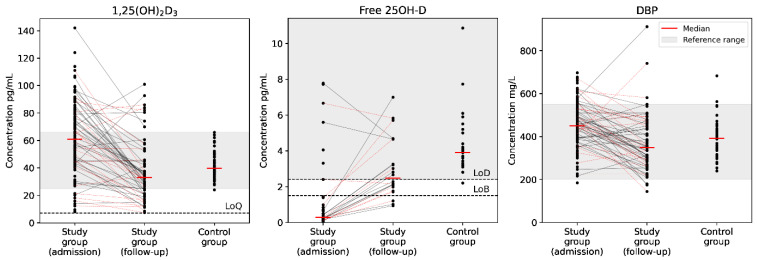
Figure 2.
Dynamic evaluation of active vitamin D metabolite (1,25(OH)2D3), free 25OH-D, and vitamin D-binding protein (DBP) concentrations in patients with COVID-19 and comparison to the reference group. Data are shown as individual values. Limits of blank (LoB), detection (LoD), and quantitation (LoQ) are shown. Red dotted lines correspond to patients with a severe course of COVID-19.

