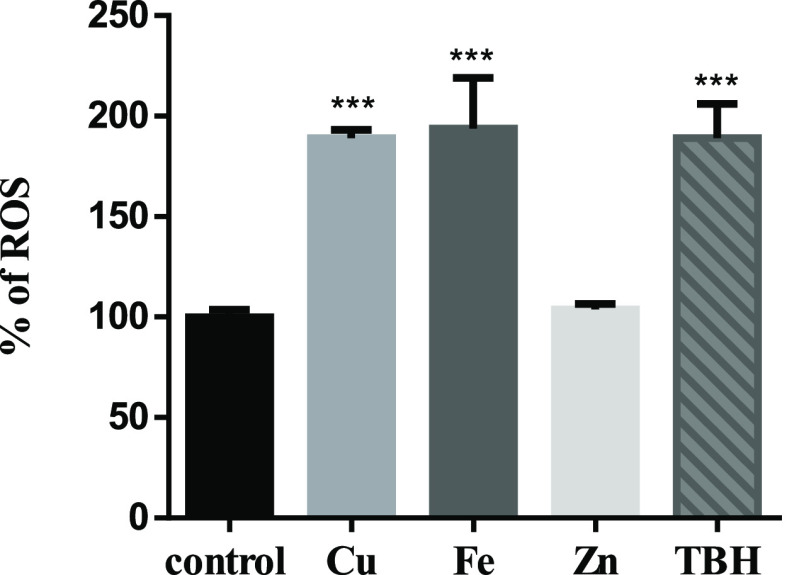
Figure 3.
Determination of ROS generation in SH-SY5Y cells by flow cytometry. DCF-DA was used to test ROS production. SH-SY5Y cells were treated for 24 h with 200 μM CuSO4 (light-gray bar), 200 μM FeSO4 (gray bar), or 200 μM ZnSO4 (almost white bar) for 24 h. Cells without metal addition (black bar) were used as control, and 500 μM TBH was used as the positive control of ROS generation (dark-gray bar). Data are expressed mean ± SD (n = 4) as the percentage of control. Significance of statistical difference was calculated using one-way ANOVA and Bonferroni’s multiple-comparison test and was indicated as ***p < 0.001 compared to the control and # compared to Cu treatment.

