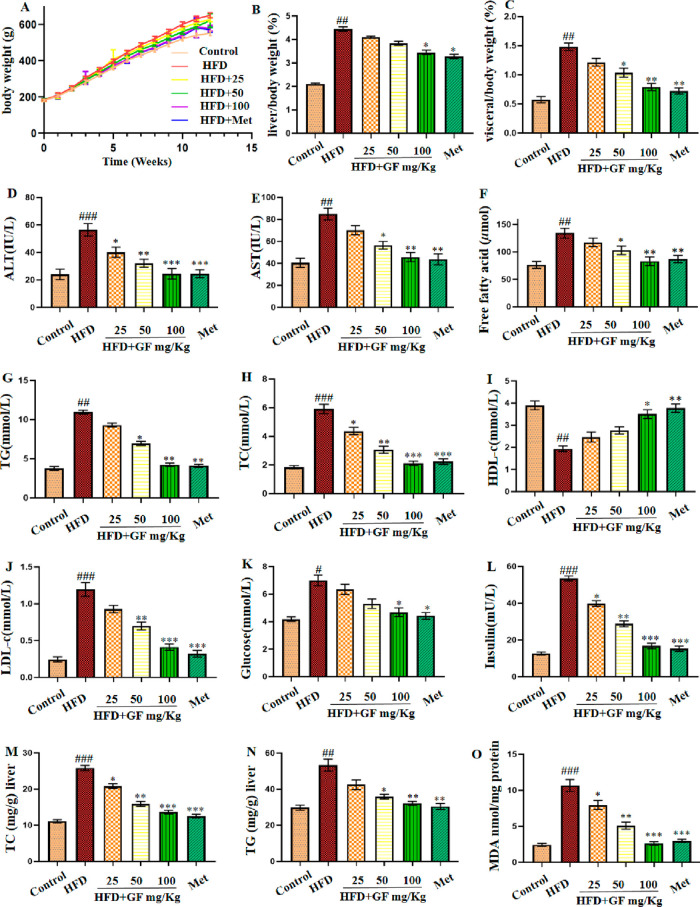
Figure 2.
Effect of the GF treatment on (A) body weight, (B) liver index/body weight (%), (C) visceral index/body weight (%), (D) ALT (IU/L), (E) AST (IU/L), (F) free fatty acid (μmol), (G) TG (mmol/L), (H) TC (mmol/L), (I) HDL-c (mmol/L), (J) LDL-c (mmol/L), (K) glucose (mmol/L), and (L) insulin (mU/L) in serum and (M) TC (mg/g) liver, (N) TG (mg/g) liver, and (O) MDA nmol/mg protein in the liver. Results are expressed as mean ± SEM (n = 6). #p < 0.05, ##p < 0.01, and ###p < 0.001 vs the control group and *p < 0.05, **p < 0.01, and ***p < 0.001 vs the HFD group.

