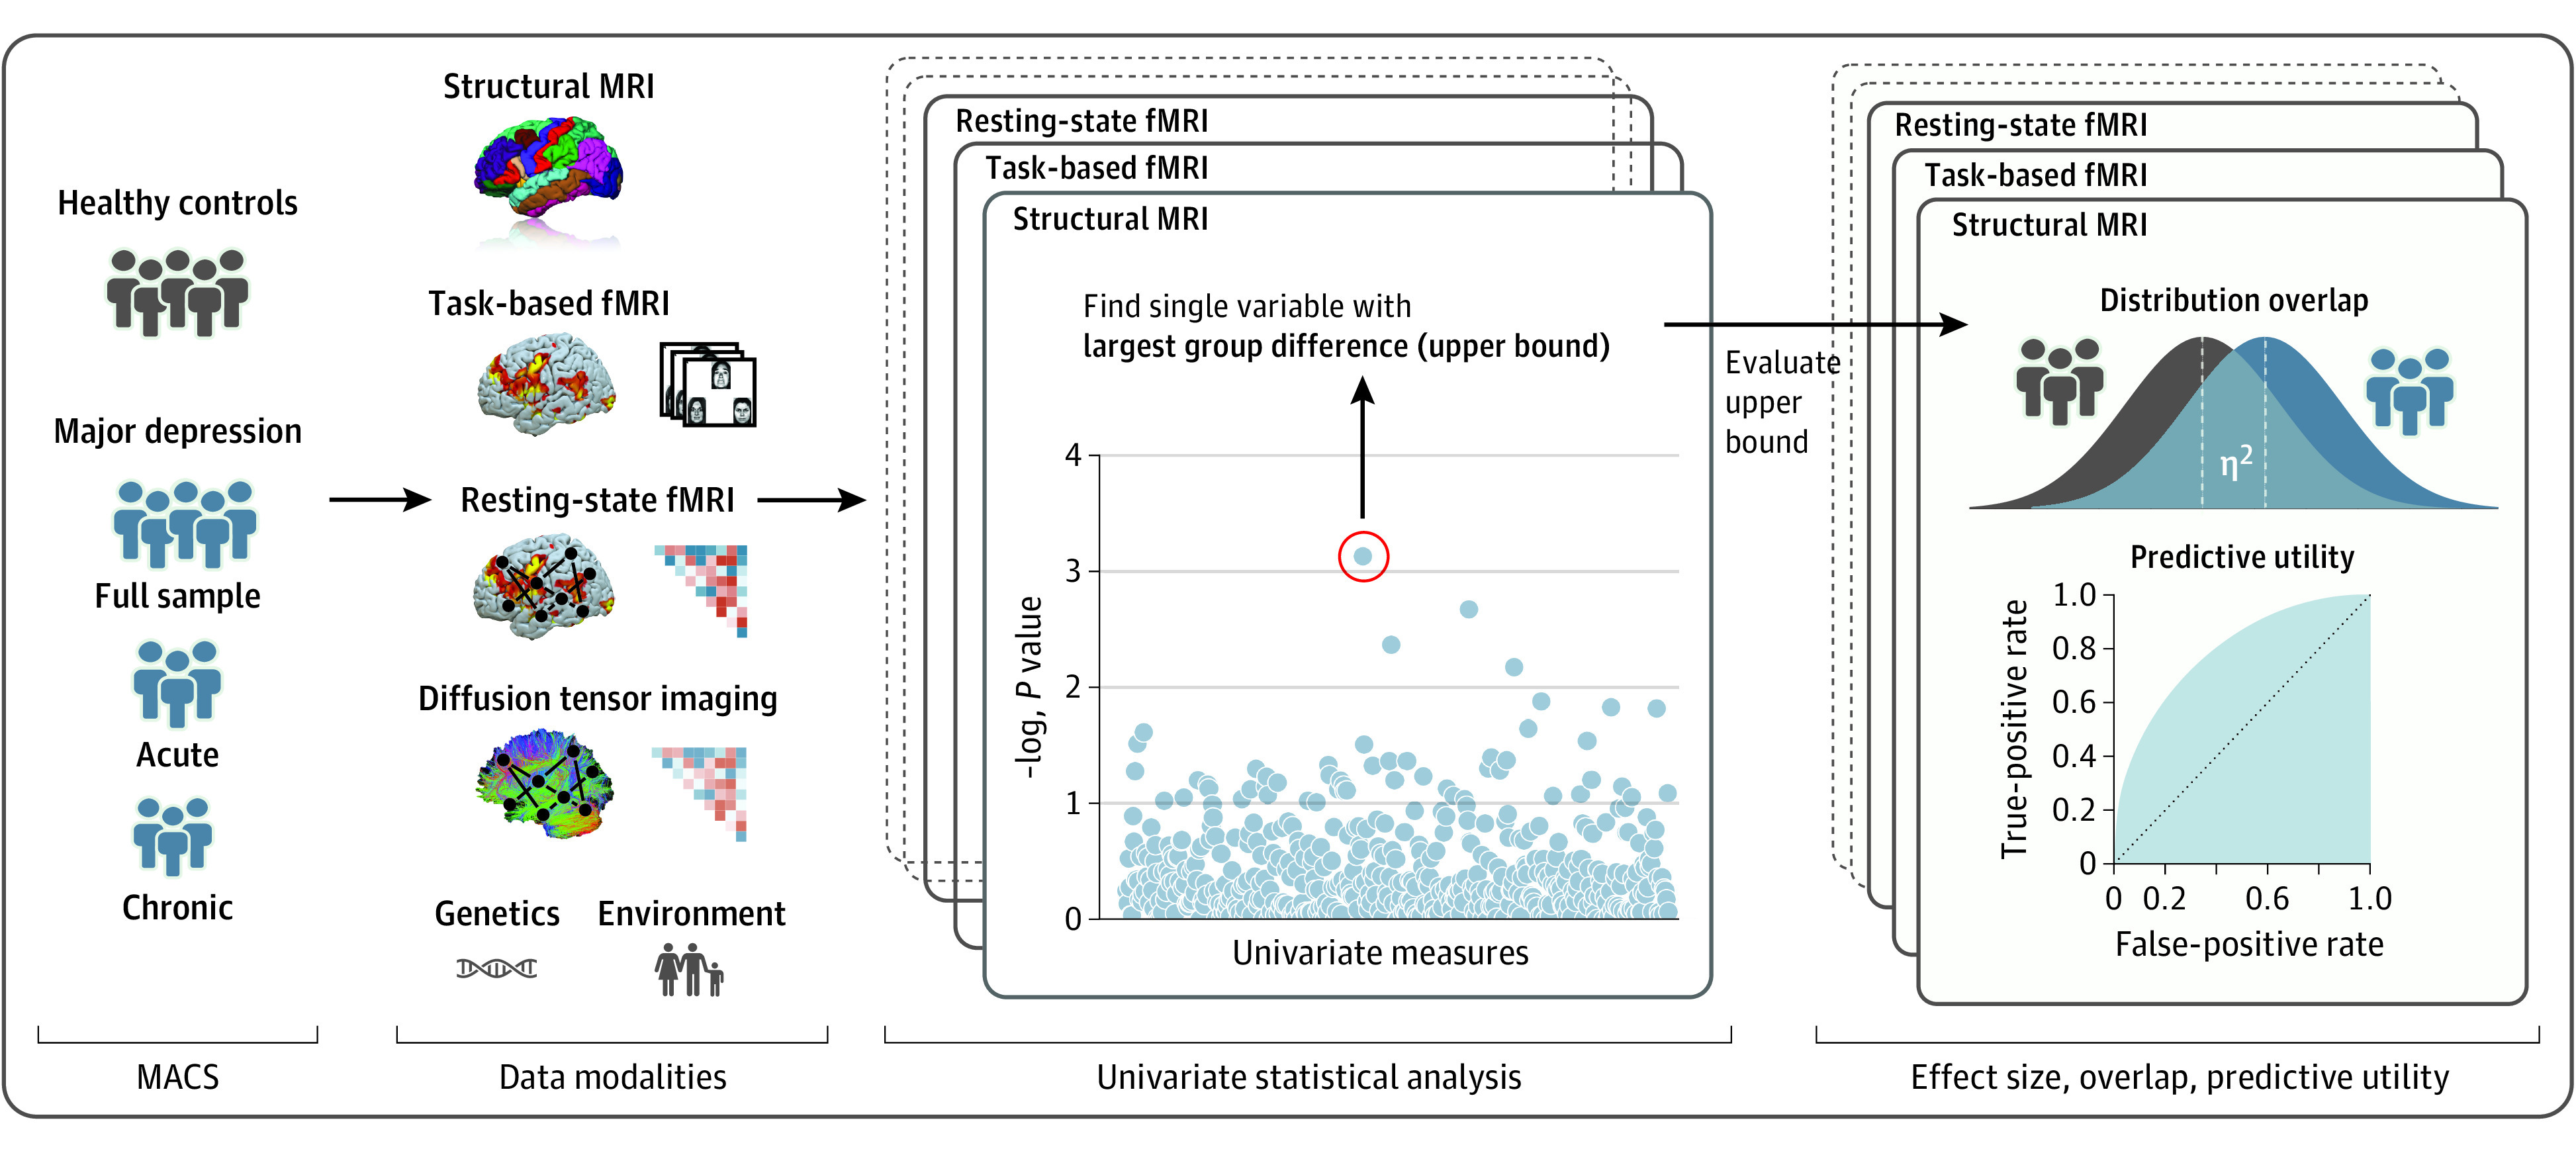
Figure 1. Research Design and Analytical Procedure.

Schematic representation of the research design and analytical procedure. For all modalities, standard univariate models are calculated to find the single variable showing the largest difference between healthy individuals and those with depression, representing an upper bound for univariate group differences. Effect size (η2), distributional overlap, and predictive utility are estimated for these peak variables of the different modalities. fMRI, functional magnetic resonance imaging; MACS, Marburg-Münster Affective Cohort Study.
