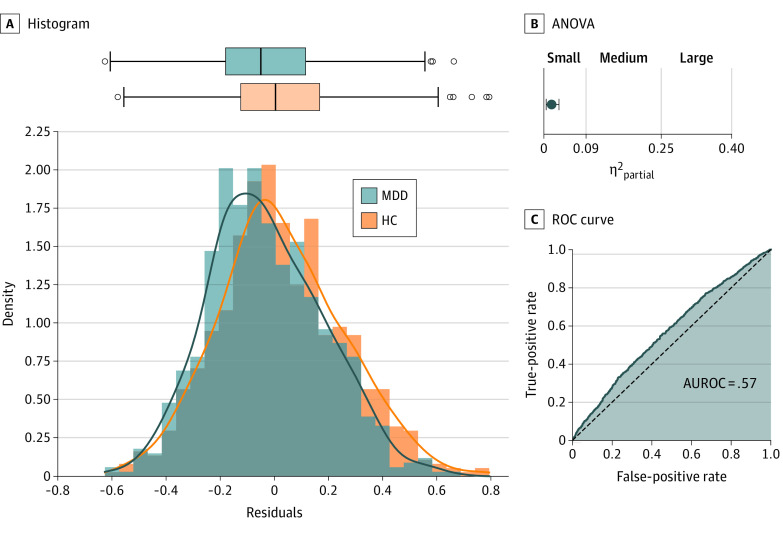
Figure 3. Effect Size, Predictive Utility, and Distributional Overlap of the Best Modality.
Distributional overlap, effect size (η2), and classification performance for the single variable displaying the largest effect across all neuroimaging modalities (resting-state functional magnetic resonance imaging [fMRI] connectivity between a region of the right peripheral visual network and a region of the somatomotor network). A, Histogram with Gaussian kernel density estimation as a solid line and box plot of the confound-corrected values of the resting-state region of interest (ROI) to ROI connectivity displaying the largest effect. Middle line of the box plot represents the median value; the end of the boxes represents the lower and upper quartile. The boundaries of the whiskers are found within 1.5 IQR. B, Partial η2 analysis of variance (ANOVA) effect size for the strongest resting-state connectivity. Light blue indicates the upper bound of a bootstrapped 95% CI. C, Receiver operating characteristic (ROC) curve for logistic regression classification based on the single variable displaying the largest effect. AUROC indicates area under the ROC curve; HC, healthy control; MDD, major depressive disorder.

