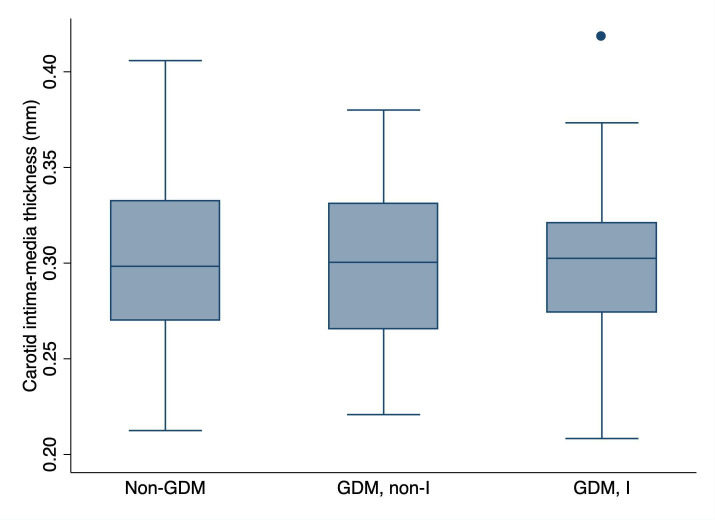
Figure 2.
Box plots of CIMT at birth by GDM exposure and assignment to a lifestyle and psychosocial intervention. This figure shows the distribution of CIMT in the offspring of women without GDM (non-GDM; n=99) and the offspring of women with GDM who were assigned to no intervention (GDM, non-I; n=48) or to a lifestyle and psychosocial intervention (GDM, I; n=53) as part of their participation in the MySweetHeart trial. The line inside the box represents the median value of the distribution, while the lower and upper boundaries of the box represent the first (Q1) and third (Q3) quartiles, respectively. The IQR corresponds to Q3–Q1. The whiskers extend from either side of the box up to 1.5*IQR (ie, Q1–1.5*IQR and Q3 +1.5*IQR). Outliers are depicted as circles. CIMT, carotid intima–media thickness; GDM, gestational diabetes mellitus; I, intervention; IQR, interquartile range; n, number of participants.

