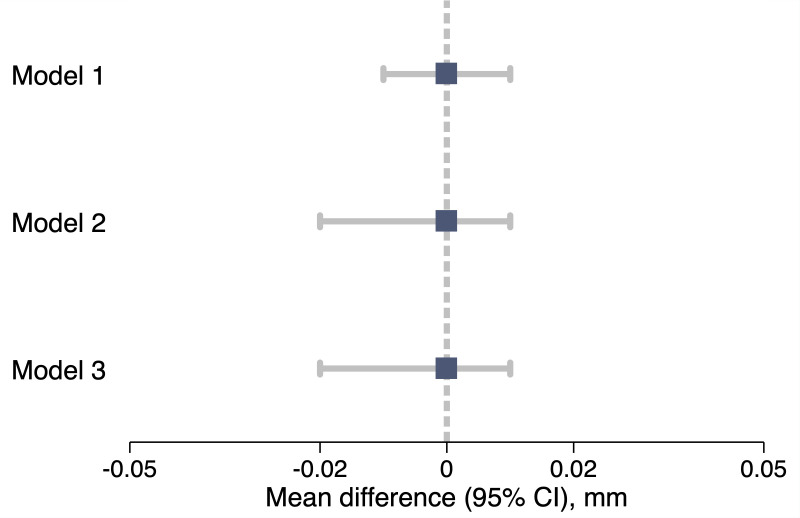
Figure 3.
Illustration of the relationship of GDM with offspring’s CIMT at birth through a forest plot. The boxes represent the mean differences in CIMT between offspring of women with and without GDM (ie, GDM vs non-GDM). The horizontal lines represent the 95% CIs. The plot was constructed using regression estimates and models presented in table 2. Model specification: Model 1 is unadjusted, while Model 2 and Model 3 are adjusted for various factors as described in the methods and footnote of table 2. CI, confidence interval; CIMT, carotid intima–media thickness; GDM, gestational diabetes mellitus.

