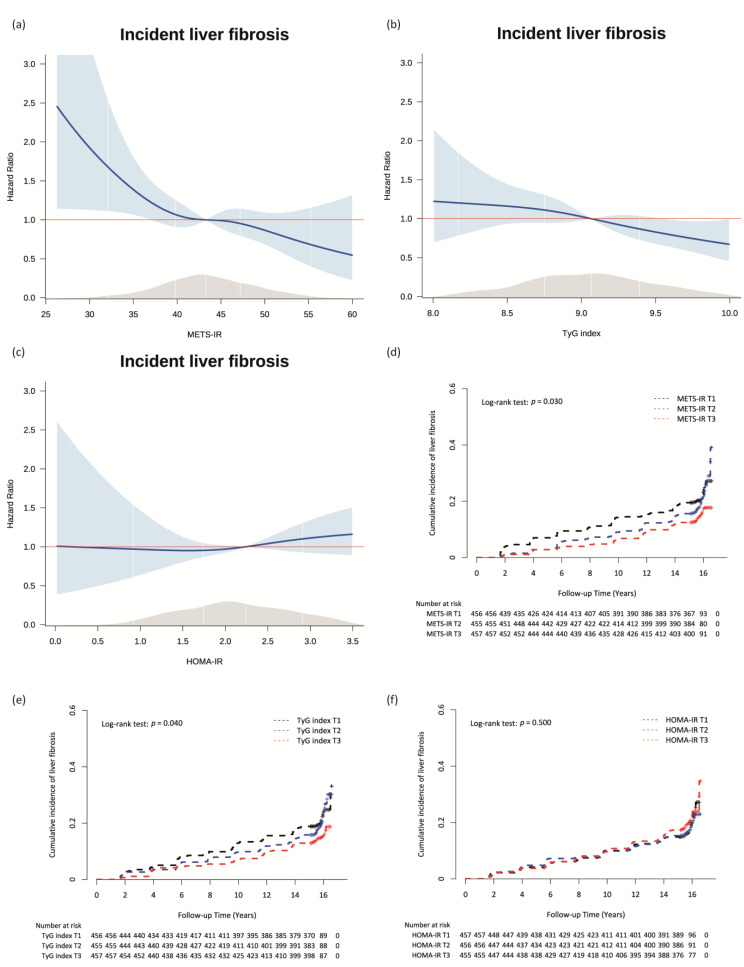
Figure 2.
Relationships between the METS-IR, TyG index, and HOMA-IR and incident ALF. Cox proportional hazards spline curve showing the dose-response relationships between incident ALF and (a) METS-IR, (b) the TyG index, and (c) HOMA-IR. The red line indicates a hazard ratio of 1. The blue lines represent the hazard ratio for incident ALF of METS-IR, TyG index, and HOMA-IR. The blue area represents 95% confidence interval for hazard ratio. The grey area represents density of values. Kaplan-Meier curves showing the cumulative incidence rate of ALF according to the tertiles of (d) the METS-IR, (e) TyG index, and (f) HOMA-IR. Abbreviations: METS-IR, metabolic score for insulin resistance; TyG, triglyceride-glucose; HOMA-IR, homeostatic model assessment for insulin resistance; ALF, advanced liver fibrosis.

