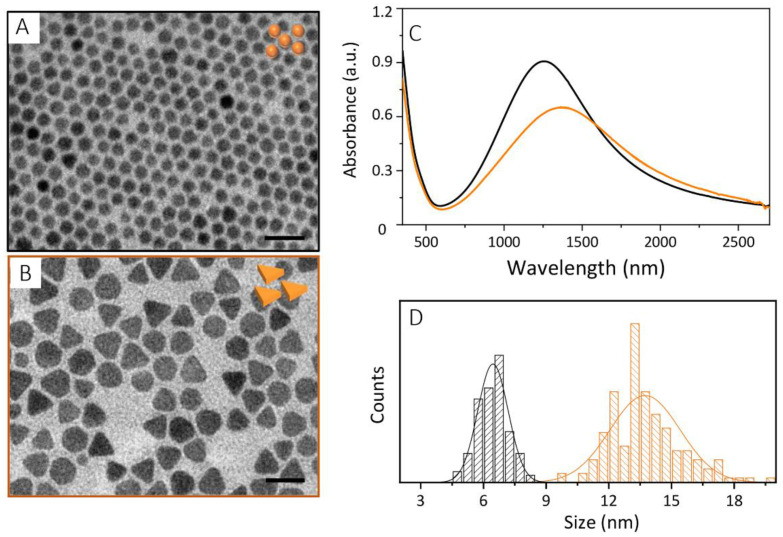
Figure 1.
TEM micrographs ((A, B), scale bar 20 nm) and UV-Vis-NIR absorption spectra (C) of Cu2−xS nanocrystals synthesized by the hot-injection approach using CuCl (A, black line C) and CuCl2 ((B), orange line (C)) precursors. Panel (D), diameter (black bar) and edge-length (orange bar) distribution of Cu2−xS nanocrystals as measured by statistical analysis of TEM micrographs reported in panel A and in B, respectively.

