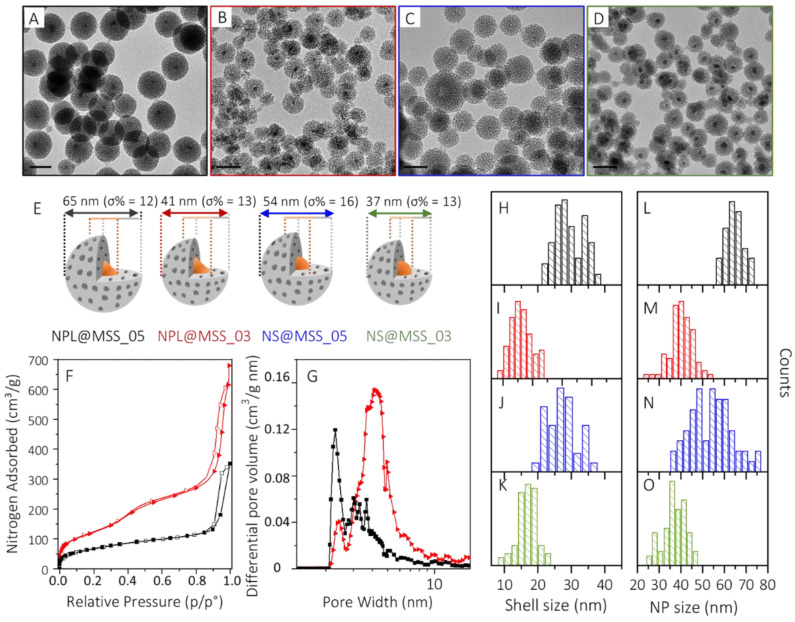
Figure 3.
(A–D) TEM micrographs (scale bar 50 nm) of NPL@MSS_05 ((A), black frame), NPL@MSS_03 ((B), red frame), NS@MSS_05 ((C), blue frame) and NS@MSS_03 ((D), green frame) and (E) representative sketches of the core-shell NPs highlighting their size and size distribution, (F) nitrogen adsorption/desorption isotherm and (G) differential pore volume distribution of NPL@MSS_05 (black line) and NPL@MSS_03 (red line). Statistical analysis of the MSS (H–K) and core-shell NPs (L–O) size distribution as measured from TEM micrographs for NPL@MSS_05 (black bars), NPL@MSS_03 (red bars), NS@MSS_05 (blue bars) and NS@MSS_03 (green bars).

