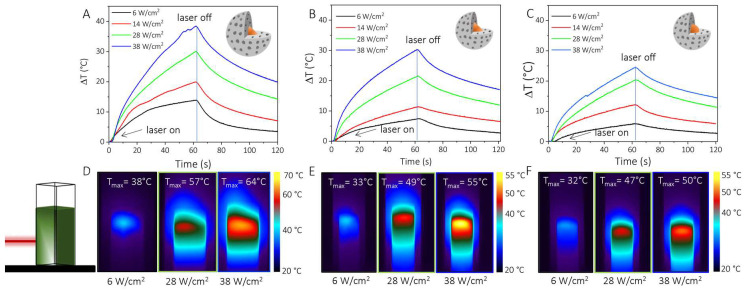
Figure 5.
(A–C) Heating/cooling curves reporting the temperature increase versus time for NPL@MSS_05 (A), NPL@MSS_03 (B) NS@MSS_03 (C), irradiated by a CW laser light at 808 nm and 6 (black line) 14 (red line), 28 (green line) and 38 (blue line) W/cm2. The CW laser has been switched off after 60 s and the cooling rate was recorded, (D–F) pictures of the temperature distribution inside the cuvette, mapped by thermal camera at laser off.

