Figure 8.
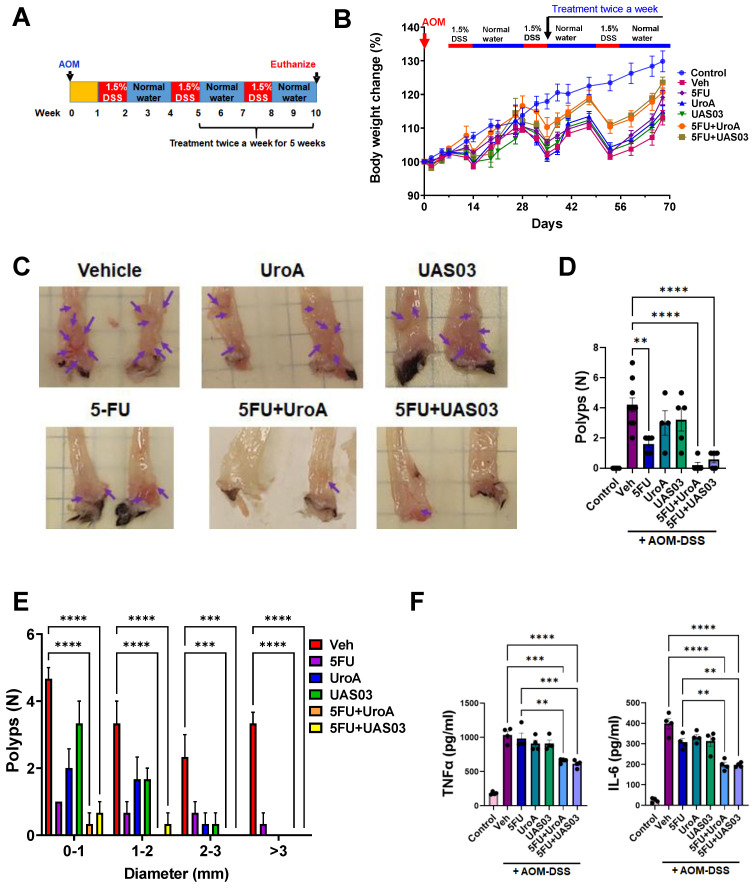
Combination therapy mitigates AOM-DSS induced colon tumors. A. Schematic representation of AOM-DSS model with treatment. Seven-week age-old C57BL/6 mice (n=10 per group) were subjected to AOM-DSS induced colon tumor model and subjected to indicated treatments. B. Body weight change graph C. Representative gross images of distal colons from mice treated with AOM-DSS. D. Total number of polyps was counted in colon of mice. E. The size of polyps in colon were determined and the average frequency of polyp distribution is shown. F. SerumTNF-α and IL-6 levels were estimated by ELISA. Error bars, ±SEM; Statistics performed one way ANOVA using Graph Prism Software. ****p < 0.0001, ***p < 0.001; **p < 0.01.

