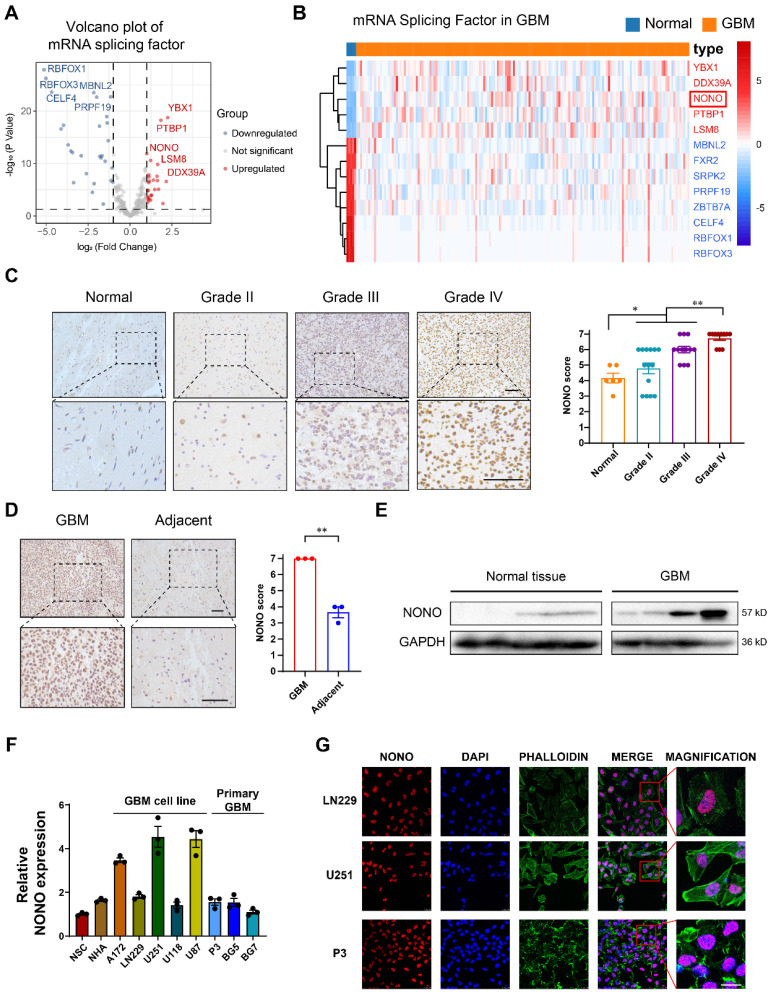
Figure 1.
Expression levels of splicing factor NONO are upregulated in glioma and associated with tumor grade. A Volcano plot showing the fold-change (log2) in expression levels of mRNA-splicing-related genes (n = 355) based on GBM (n = 168) vs non-neoplastic brain tissue samples (n = 5). Data were obtained from the TCGA dataset. B The expression heatmap of the differentially expressed mRNA-splicing-related genes between GBMs and non-neoplastic brain tissue samples from the TCGA dataset. C Representative images of IHC staining of NONO in non-neoplastic brain (n = 6) and different pathological grades of gliomas (n = 37), and scoring. Scale bar = 100 μm. D Representative images of NONO IHC staining in GBM and adjacent brain tissues from 3 paired samples, and scoring. Scale bar = 100 μm. E Western blot analysis of NONO expression in non-neoplastic brain tissue and GBM samples (n = 3). F qRT-PCR analysis of NONO mRNA expression in 2 non-cancer cell lines and 8 GBM cell lines. GAPDH was used for normalization (n = 3). G Immunofluorescence staining showing NONO (red) subcellular localization (n = 3). Nuclei are stained with DAPI (blue) and actin filaments with Phalloidin (green). Scale bar = 25 μm. Data are shown as mean ± SEM. *P < 0.05, **P < 0.01.

