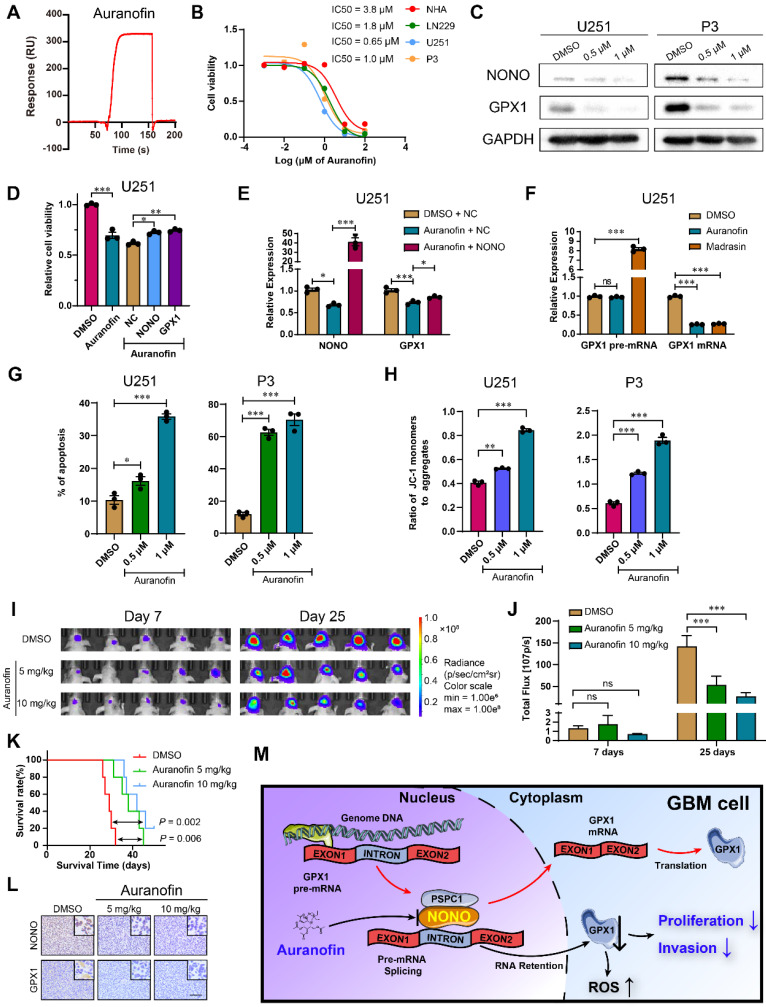
Figure 7.
Auranofin inhibits GBM through the NONO-GPX1 pathway. A Red lines represent the global interaction of Auranofin with NONO in the SPR assay (n = 3). B CCK-8 assay for relative cell viability of NHA, LN229, U251 and P3 treated with Auranofin (n = 3). Dose-inhibition curve and calculation of IC50s. C Western blot to detect NONO and PSPC1 in U251 and P3 treated with DMSO, 0.5 μM or 1 μM Auranofin (n = 3). D CCK-8 assay for relative cell viability of Auranofin-treated U251 rescue experiments with NONO and GPX1 as determined at 48 h (n = 3). Cell viability of the DMSO group was used for normalization. E qRT-PCR analysis of NONO and GPX1 mRNAs in U251-NC or -NONO after 1 μM Auranofin treatment (n = 3). GAPDH was used for normalization. F qRT-PCR analysis of GPX1 pre-mRNA and mRNA in U251 after DMSO, 1 μM Auranofin or 30 μM Madrasin treatment (n = 3). GAPDH was used for normalization. G Statistics of apoptosis for U251 and P3 treated with DMSO, 0.5 μM or 1 μM of Auranofin (n = 3). H Statistics of JC1-Aggregate and JC1 Monomers of U251 and P3 treated with DMSO, 0.5 μM or 1 μM of Auranofin (n = 3). I, J Bioluminescence images at day 7 and day 25 for mice (n = 5 per group) orthotopically implanted with luciferase expressing P3 cells treated with DMSO, 5 mg/kg or 10 mg/kg Auranofin. The bioluminescence was collected for analysis of tumor growth. K Kaplan-Meier survival curve of groups of xenograft bearing mice (n = 5 per group). The Log-rank test was used to obtain statistical significance. L IHC for NONO and GPX1 levels in the GBM xenografts. Scale bar = 100 μm. M Schematic diagram of Auranofin targeting NONO-mediated splicing of GPX1 pre-mRNA. Data are shown as mean ± SEM. *P < 0.05, **P < 0.01, ***P < 0.001.

