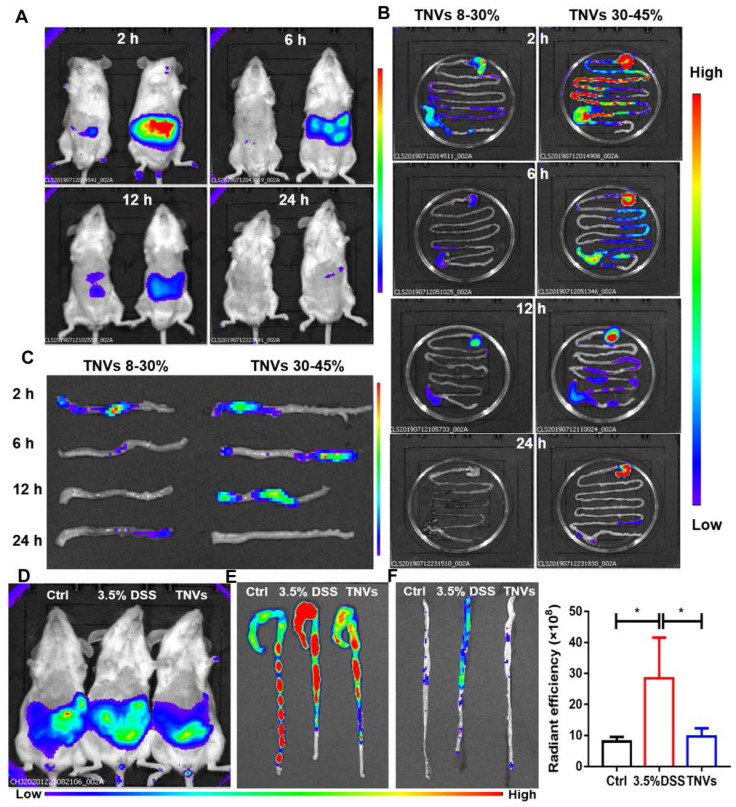
Figure 2.
In vivo and ex vivo distribution of DiR-labeled TNVs. A. Whole body imaging of the mice at 2, 6, 12 and 24 h after oral administration of TNVs originated from 8%-30% (left) and 30%-45% (right) band. B. The distribution of DiR-labeled TNVs in the gastrointestinal tract at different time points. C. The distribution of DiR-labeled TNVs in the distal colons at different time point. D. Whole body imaging of the mice (healthy, DSS-induced and TNVs treated) at 6 h with DiR-labeled TNVs treatment. E-F. The accumulation and radiant efficiency statistics of DiR-labeled TNVs in the feces-contained and no-feces colon dissected from mice at different condition. Data are shown as mean ± SD, n = 3. Significance as *P < 0.05.

