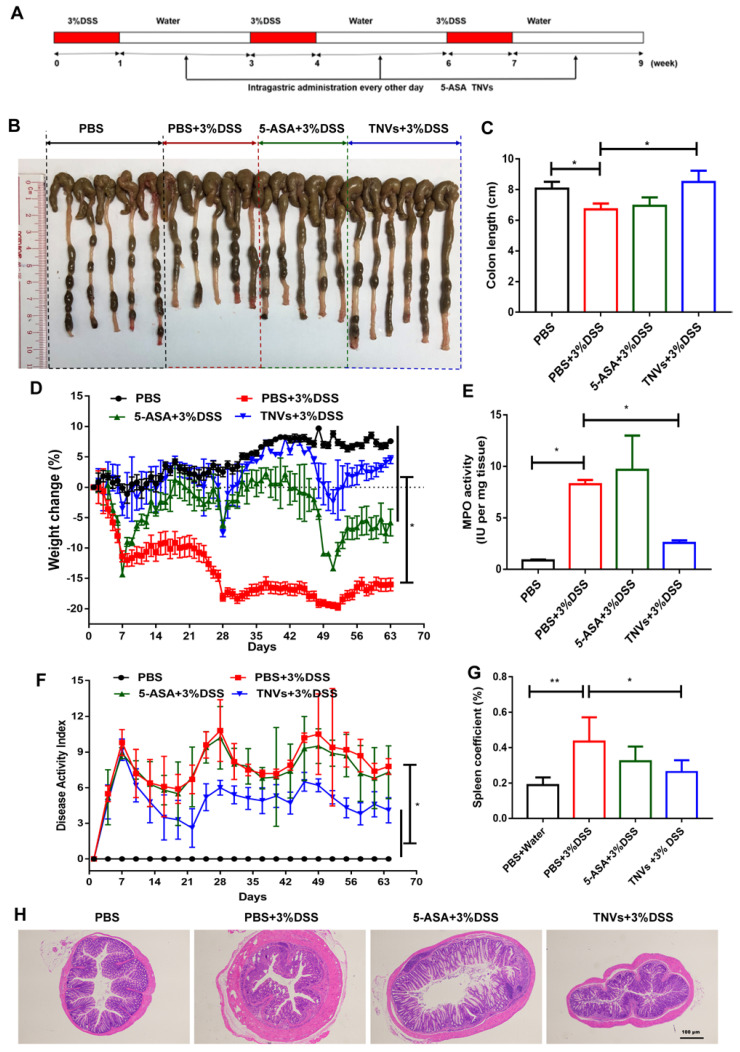
Figure 7.
TNVs extenuated colitis-related symptoms in DSS-induced chronic colitic mice. A. The flow chart represents the establishment of mice colitis model and drug treatment design. B-C. Representative images of colons and average colon length from different groups. D. Body weight change expressed as the percentage of the day-zero weight. E. Colonic MPO activity, F. DAI, G. Spleen coefficient, and H. histological sections of distal colons stained with H&E (4× magnification). Data shown as means ± SD, n = 5. Significance as *P < 0.05.

