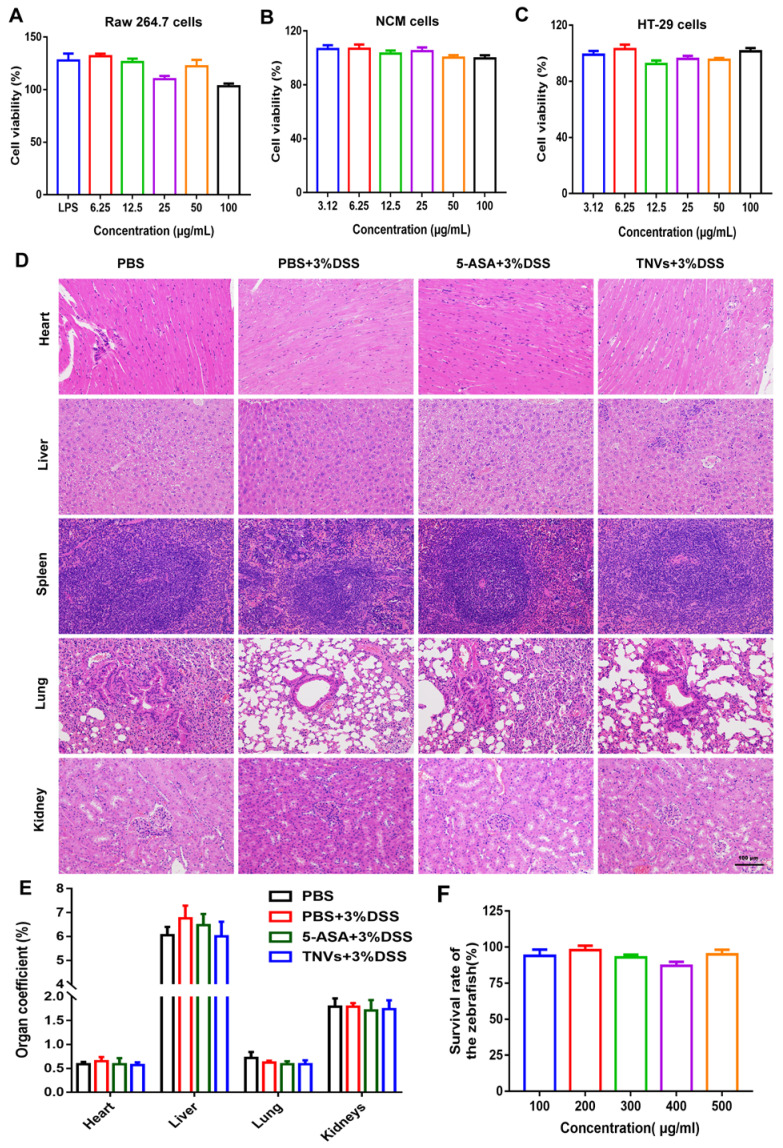
Figure 8.
In vitro and in vivo biosafety evaluation of TNVs. A-C. Viabilities of Raw 264.7, NCM 460 and HT-29 cells after incubation with TNVs at different concentrations for 24 h, n = 6. D. H&E staining of main organs slices from mice H&E staining of main organs slices from mice treated with TNVs. E. The organs coefficients, n = 5, and F. The survival rate of zebrafish after treatment with TNVs at different concentrations for 24 h, n = 15. Data shown as means ± SD.

