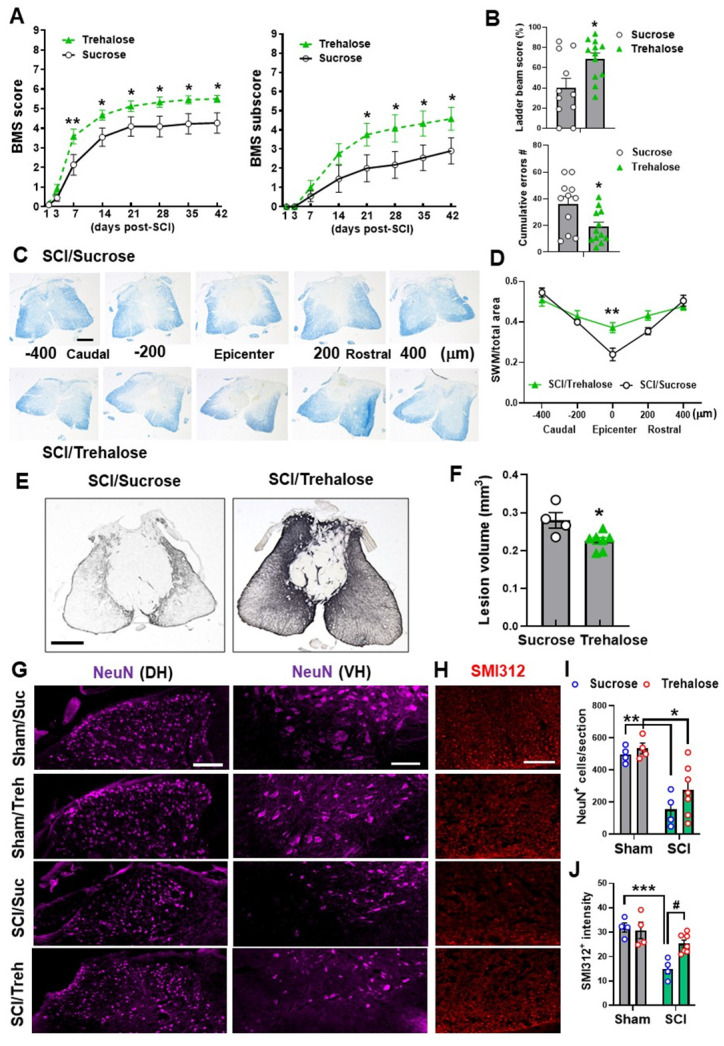
Figure 11.
Effects of Trehalose on long-term functional outcomes following SCI. Young adult C57BL/6 mice were administrated 5% trehalose or sucrose via oral gavage twice per day for the first week followed by continuous administration at 2.5% trehalose or sucrose in their drinking water for 6 w. (A-B) BMS and subscores (A) showed significantly better recovery of their hindlimb motor function in trehalose-treated mice compared to sucrose-treated animals. Trehalose treated group showed significantly higher ladder beam scores and lower number of cumulative errors compared to sucrose control group in horizontal ladder test (B). n = 11 (sucrose) and 12 mice (trehalose). * p < 0.05, ** p < 0.01 vs. SCI/Sucrose group. (C-D) Representative images and quantification of SWM at 6 w post-injury. n = 4 (SCI/Sucrose) and 7 mice (SCI/Trehalose). ** p < 0.01 vs. SCI/Sucrose group. Scale bars = 250 μm. (E-F) Representative images of GFAP-DAB staining and quantification of the lesion volume at 6 w SCI. n = 4 (SCI/Sucrose) and 7 mice (SCI/Trehalose). * p < 0.05 vs. SCI/Sucrose. Scale bars = 250 μm. (G-J) Immunohistochemistry (IHC) representative images of NeuN (G, purple) in the dorsal (DH) and ventral horn (VH) regions of the spinal cord at 6w after injury. H indicates representative images of the neurofilament marker SMI312 (red) in the surrounding white matter. Quantification of NeuN+ cells in the grey matter (I) and the SMI312+ intensity in the white matter (J) are presented. Scale bars = 100 μm (G) and 50 μm (H). n = 4 (Sham/Suc), 4 (Sham/Treh), 4 (SCI/Suc), and 7 (SCI/Treh) mice/group. * p < 0.05, ** p < 0.01, *** p < 0.001 vs. Sham groups; # p < 0.05 vs. SCI/Suc group. Two-way repeated measurement ANOVA followed by Holm-Sidak's post-hoc test for A, Mann Whitney test for B (upper panel) and D, unpaired t test for B (low panel) and F, Two-way ANOVA followed by Tukey's multiple comparison for I-J.

