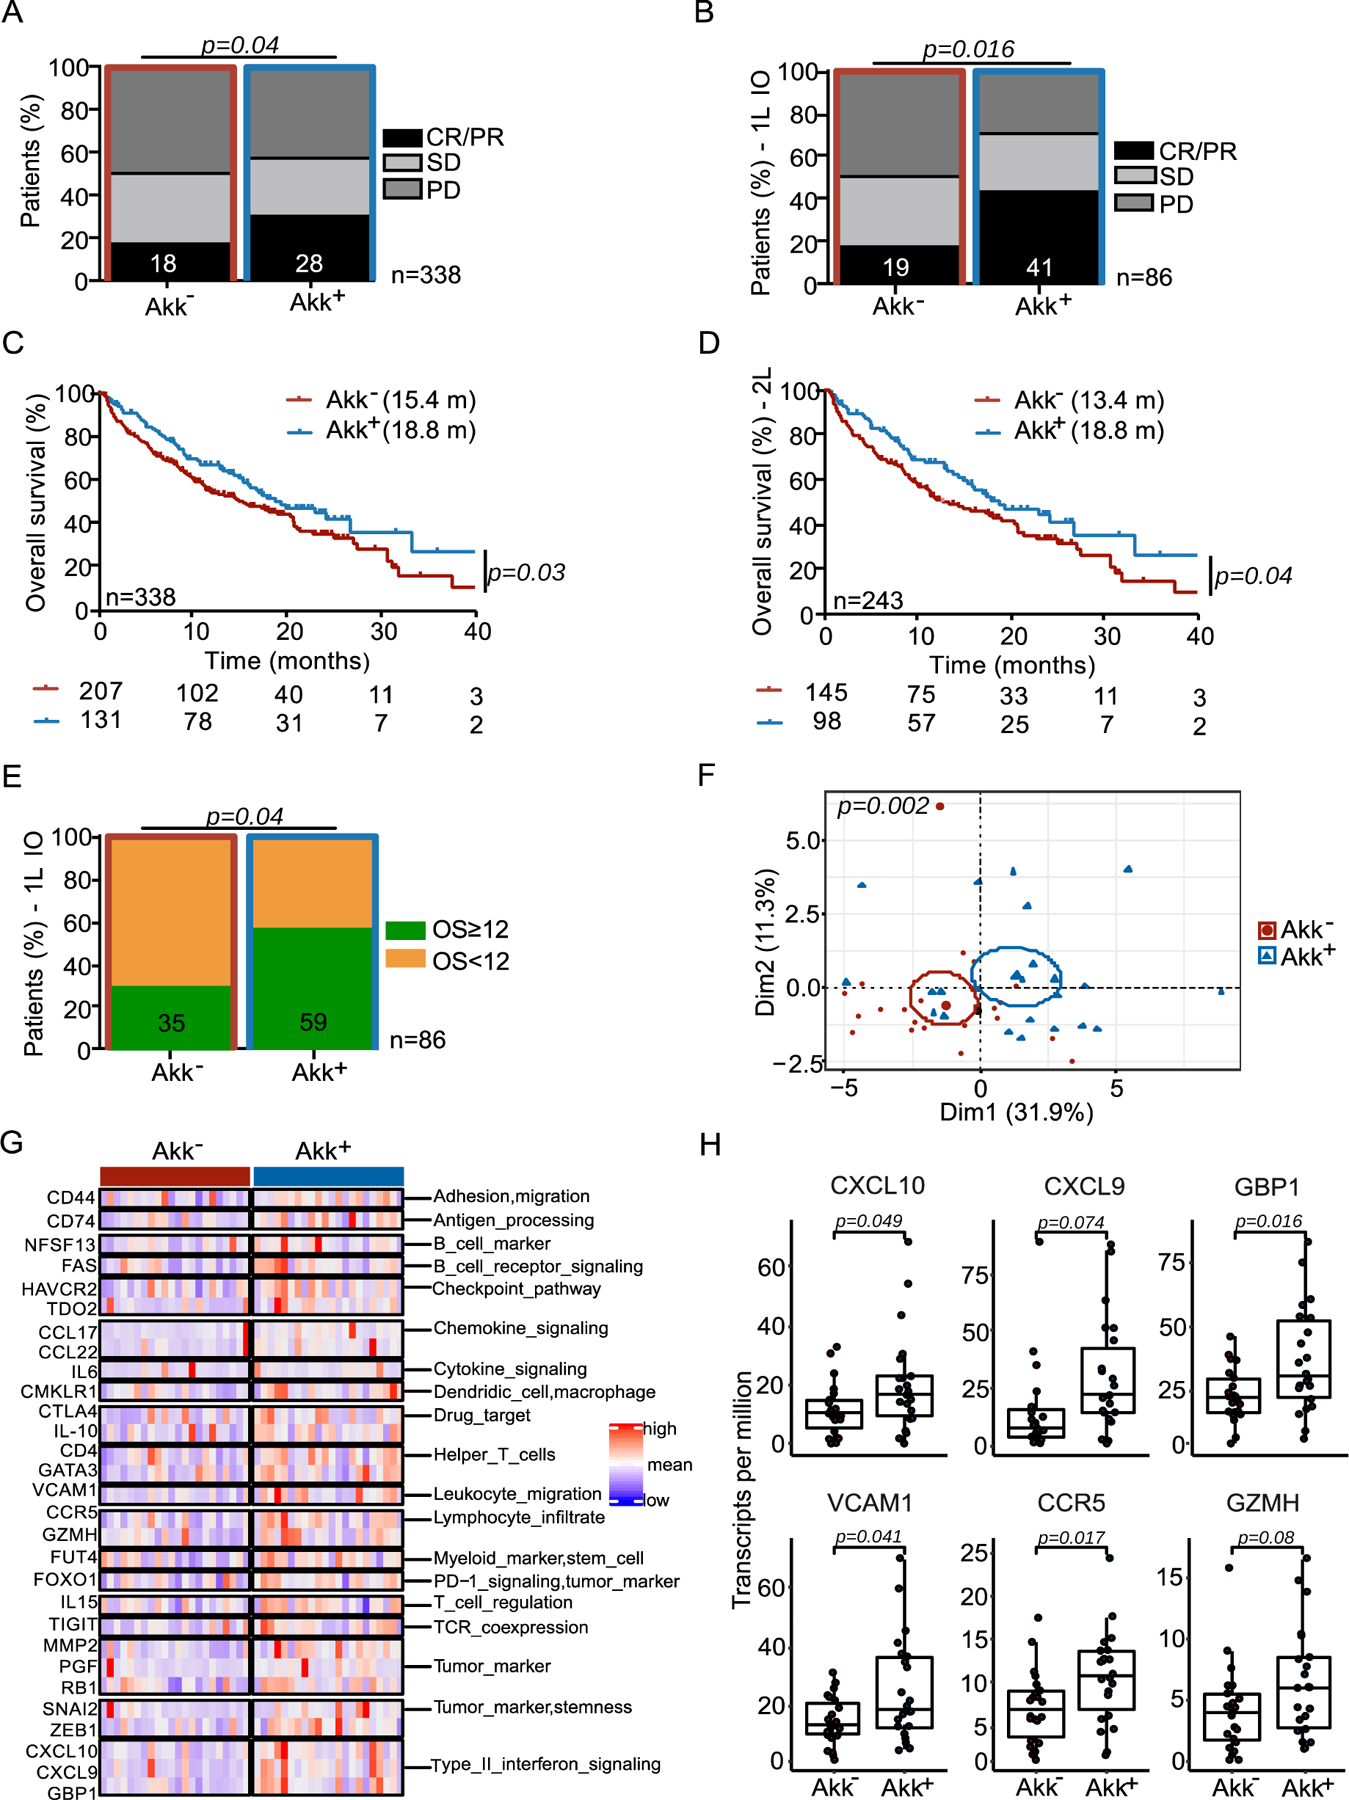
Figure 1. Stool A. muciniphila (Akk) is associated with ICI clinical benefit.

A-B Correlations between stool Akk and ORR in 1L+2L (n=338) and 1L immunotherapy NSCLC (n=86) patients. CR; complete response. PR; partial response, SD; stable disease, PD; progressive disease analyzed using Chi-square test. C-D Kaplan-Meier curves and Cox regression analyses of overall survival (OS) of 1L+2L (n=338) and 2L (n=243) according to Akk status. E. Difference of the intestinal prevalence of Akk between patients with OS < 12 months versus > 12 months in 1L immunotherapy (IO) analyzed using Chi-square test. F-H. RNA sequencing of tumor biopsies in a sub-group of 44 NSCLC patients (17 non-metastatic and 27 metastatic patients, Table S3). F. Principal Component Analysis (PCoA) of the differentially expressed genes according to intestinal prevalence of Akk, using the 395 immune-related gene selection of the Oncomine Immune Response Research Assay indicating significant differences using a Mann-Whitney p-value < 0.10 through PERMANOVA test using Euclidian distance. G. Heatmap of the differentially expressed gene products after normalization (between Akk+ vs Akk− patients) classified by category. H. Boxplot of selected gene expression values according to Akk groups. Differences between groups were assessed with Mann-Whitney tests. C-X-C motif chemokine ligand 10 (CXCL10), C-X-C motif chemokine ligand 9 (CXCL9), Guanylate binding protein 1 (GBP1), Vascular cell adhesion protein 1 (VCAM1), C-C chemokine receptor type 5 (CCR5), Granzyme H (GZMH).
