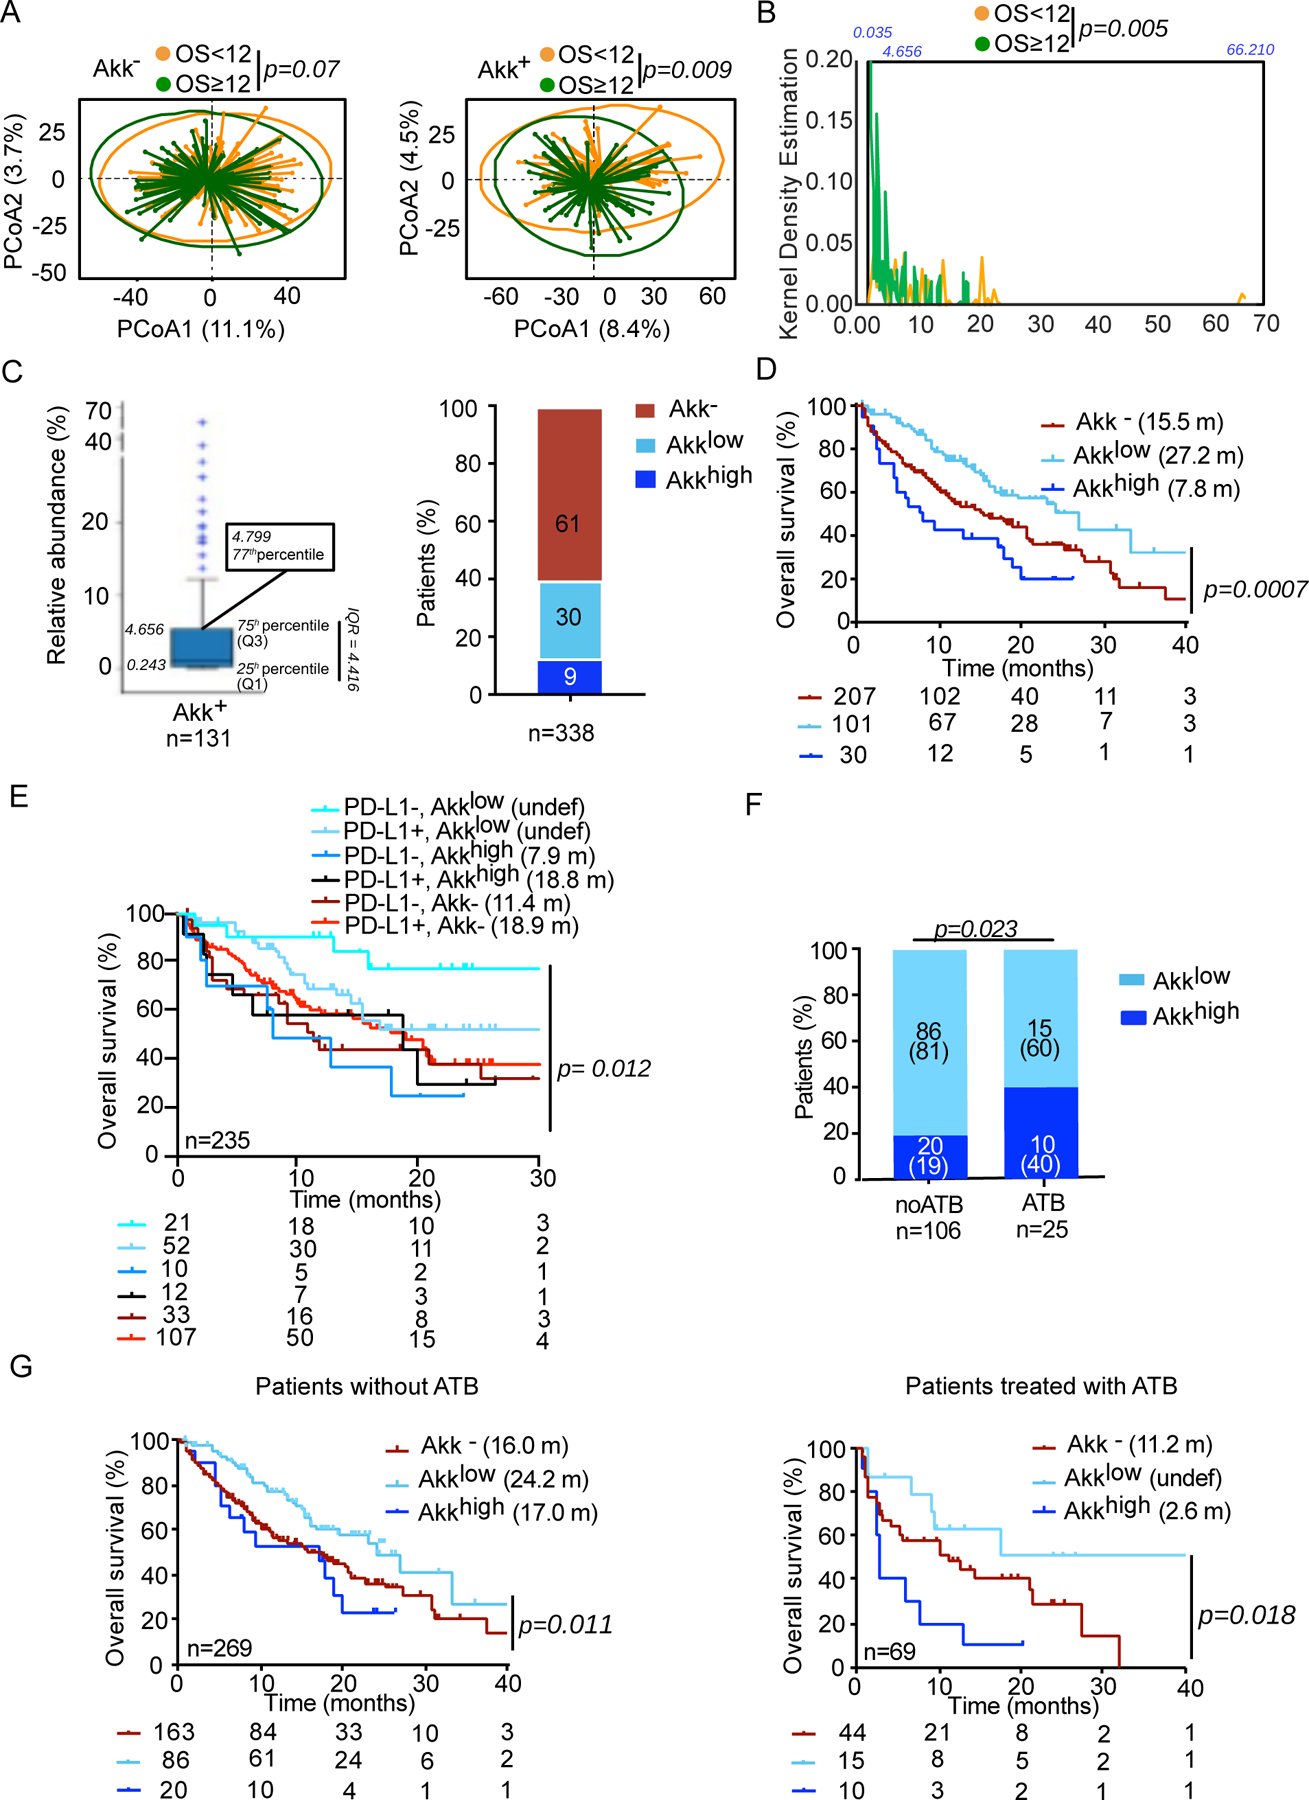
Figure 2. Akk relative abundance represents a prognostic marker of ICI.

A. Beta-diversity measured by Bray-Curtis Index represented by Principal Coordinates analysis (PCoA) between Akk− versus Akk+ groups between OS < or ≥ 12 months within each subgroup. OS; overall survival. p-values were calculated using PERMANOVA with 999 permutations. B. Kernel density estimation aligning two variables, OS < or ≥ 12 and relative abundance of Akk in the entire cohort of 338 patients. C. Distribution of the relative abundance of Akk in patients with detectable Akk according to 77th percentile (left panel) and percentages of patients within each of the three groups of Akk relative abundance (right panel). Akk−: undetectable Akk, Akklow: Akk relative abundance between 0.035–4.799%, Akkhigh: >4.799% (77th percentile). D-E. Kaplan-Meier curve and Cox regression multivariate analysis of overall survival in 338 NSCLC patients according to Akk relative abundance segregated in 3 groups (Akk−, Akklow and Akkhigh) (D) and considering PD-L1 expression (E). F. Distribution of patients according to Akk relative abundance segregated in 2 groups (Akklow and Akkhigh) and ATB use (noATB: no exposure to ATB, ATB: antibiotics exposure within 2 months prior to ICI initiation). G. Kaplan-Meier curve and Cox regression multivariate analysis of overall survival in 338 NSCLC patients according to Akk relative abundance segregated in 3 groups (Akk−, Akklow and Akkhigh) and ATB use (noATB n=269, left panel and ATB n=69, right panel).
