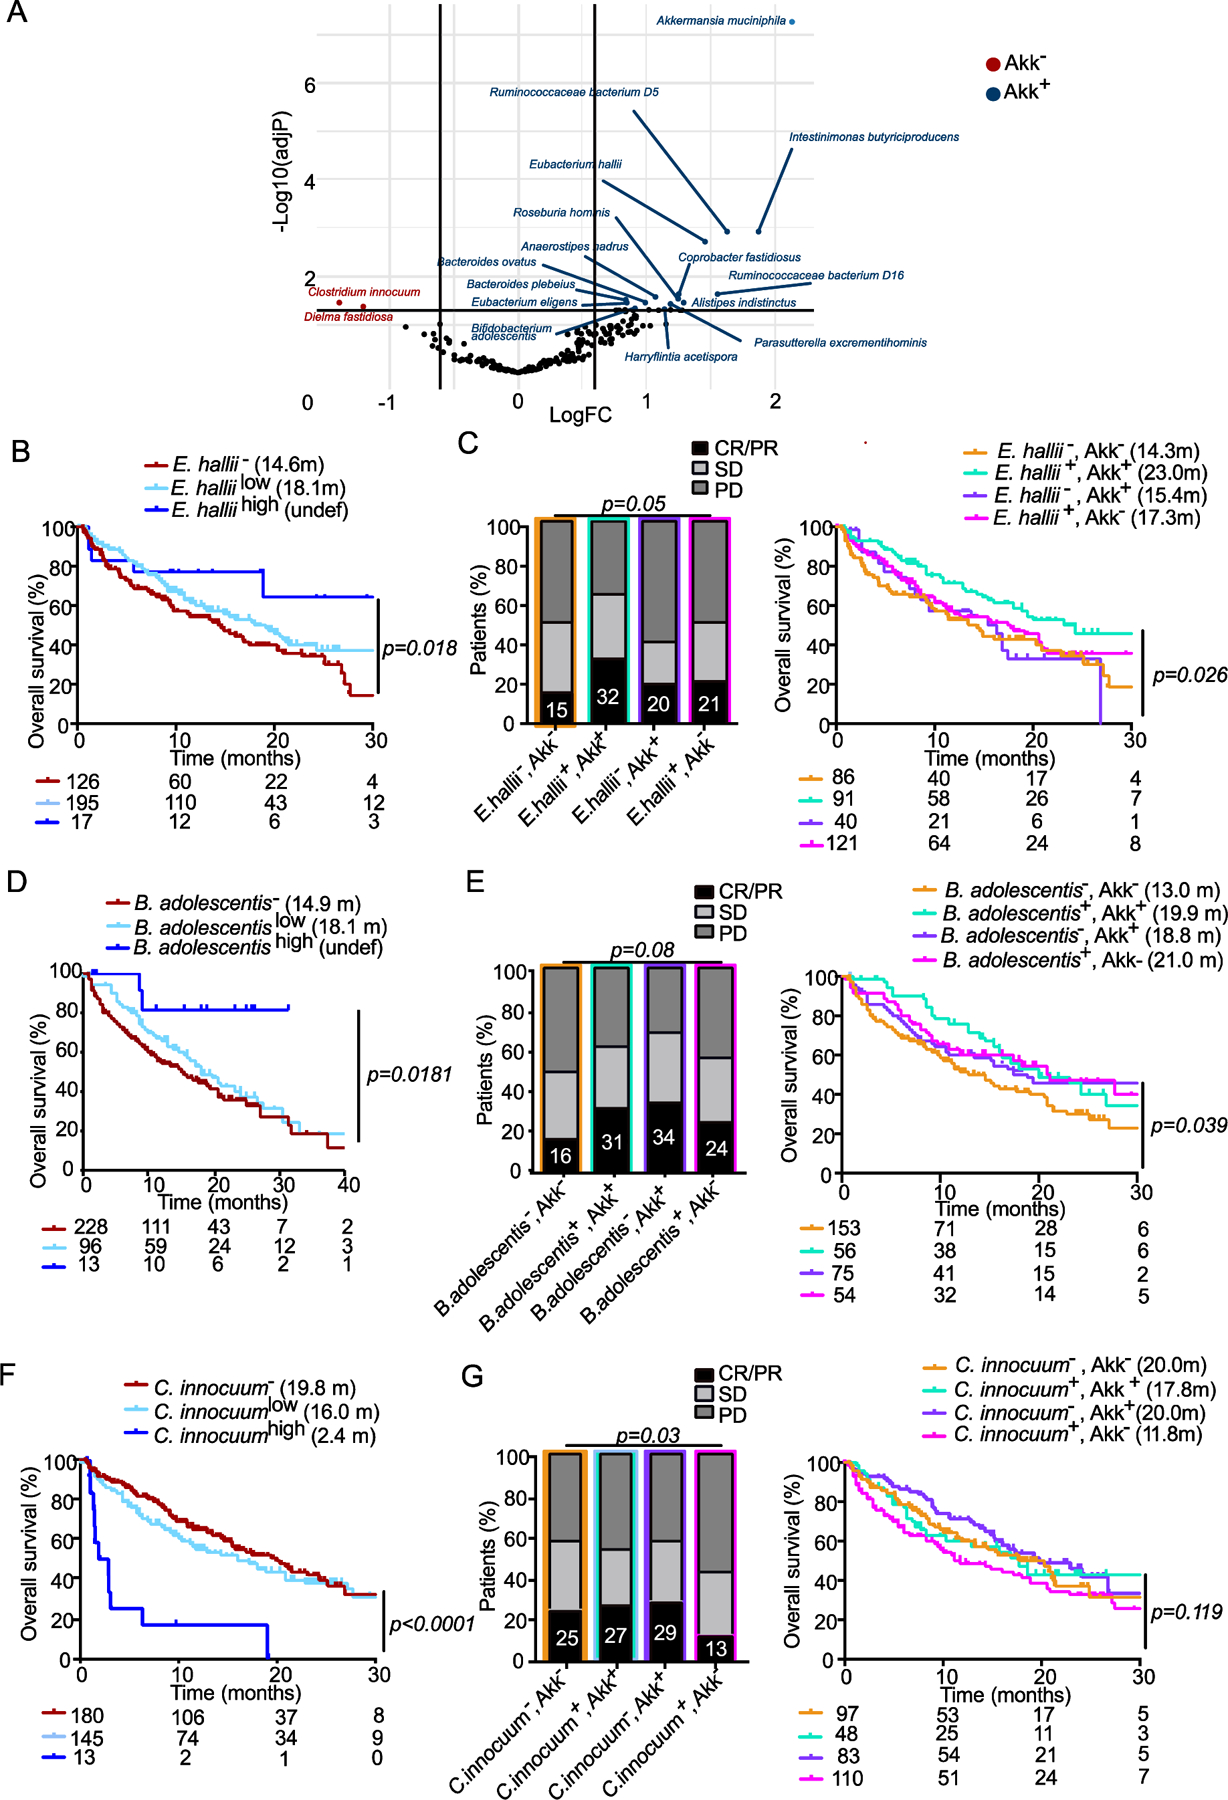
Figure 3. Stratification of clinical outcome based on other components of the Akk - associated ecosystem.

A. Volcano plot (indicating Fold Change (FC) and p-values in ANOVA statistical analyses) to segregate taxonomic species (with a prevalence> 2.5%) according to their relative abundance in baseline fecal specimen of 338 patients based on their association with Akk: species significantly associated with or excluded from Akk− enriched ecosystems (Akk+, blue dots, Akk−, red dots) B, D, F. Kaplan Meier overall survival curves in 338 NSCLC patients according to the trichotomic distribution of the relative abundance of beneficial or harmful bacteria (undetectable bacterium: −, low versus high) retained in the LEfSe model, MaAsLin2 and the Volcano plot/ANOVA Table S6). C, E, G. Influence of collateral bacteria associated with Akk (retained in Table S6) in the Akk-associated impact on ORR and OS in a dichotomic pattern (presence/absence) using Chi-square test (for ORR, left panels) and Cox regression multivariate analysis for Kaplan Meier curves (right panels). CR; complete response. PR; partial response, SD; stable disease, PD; progressive disease.
