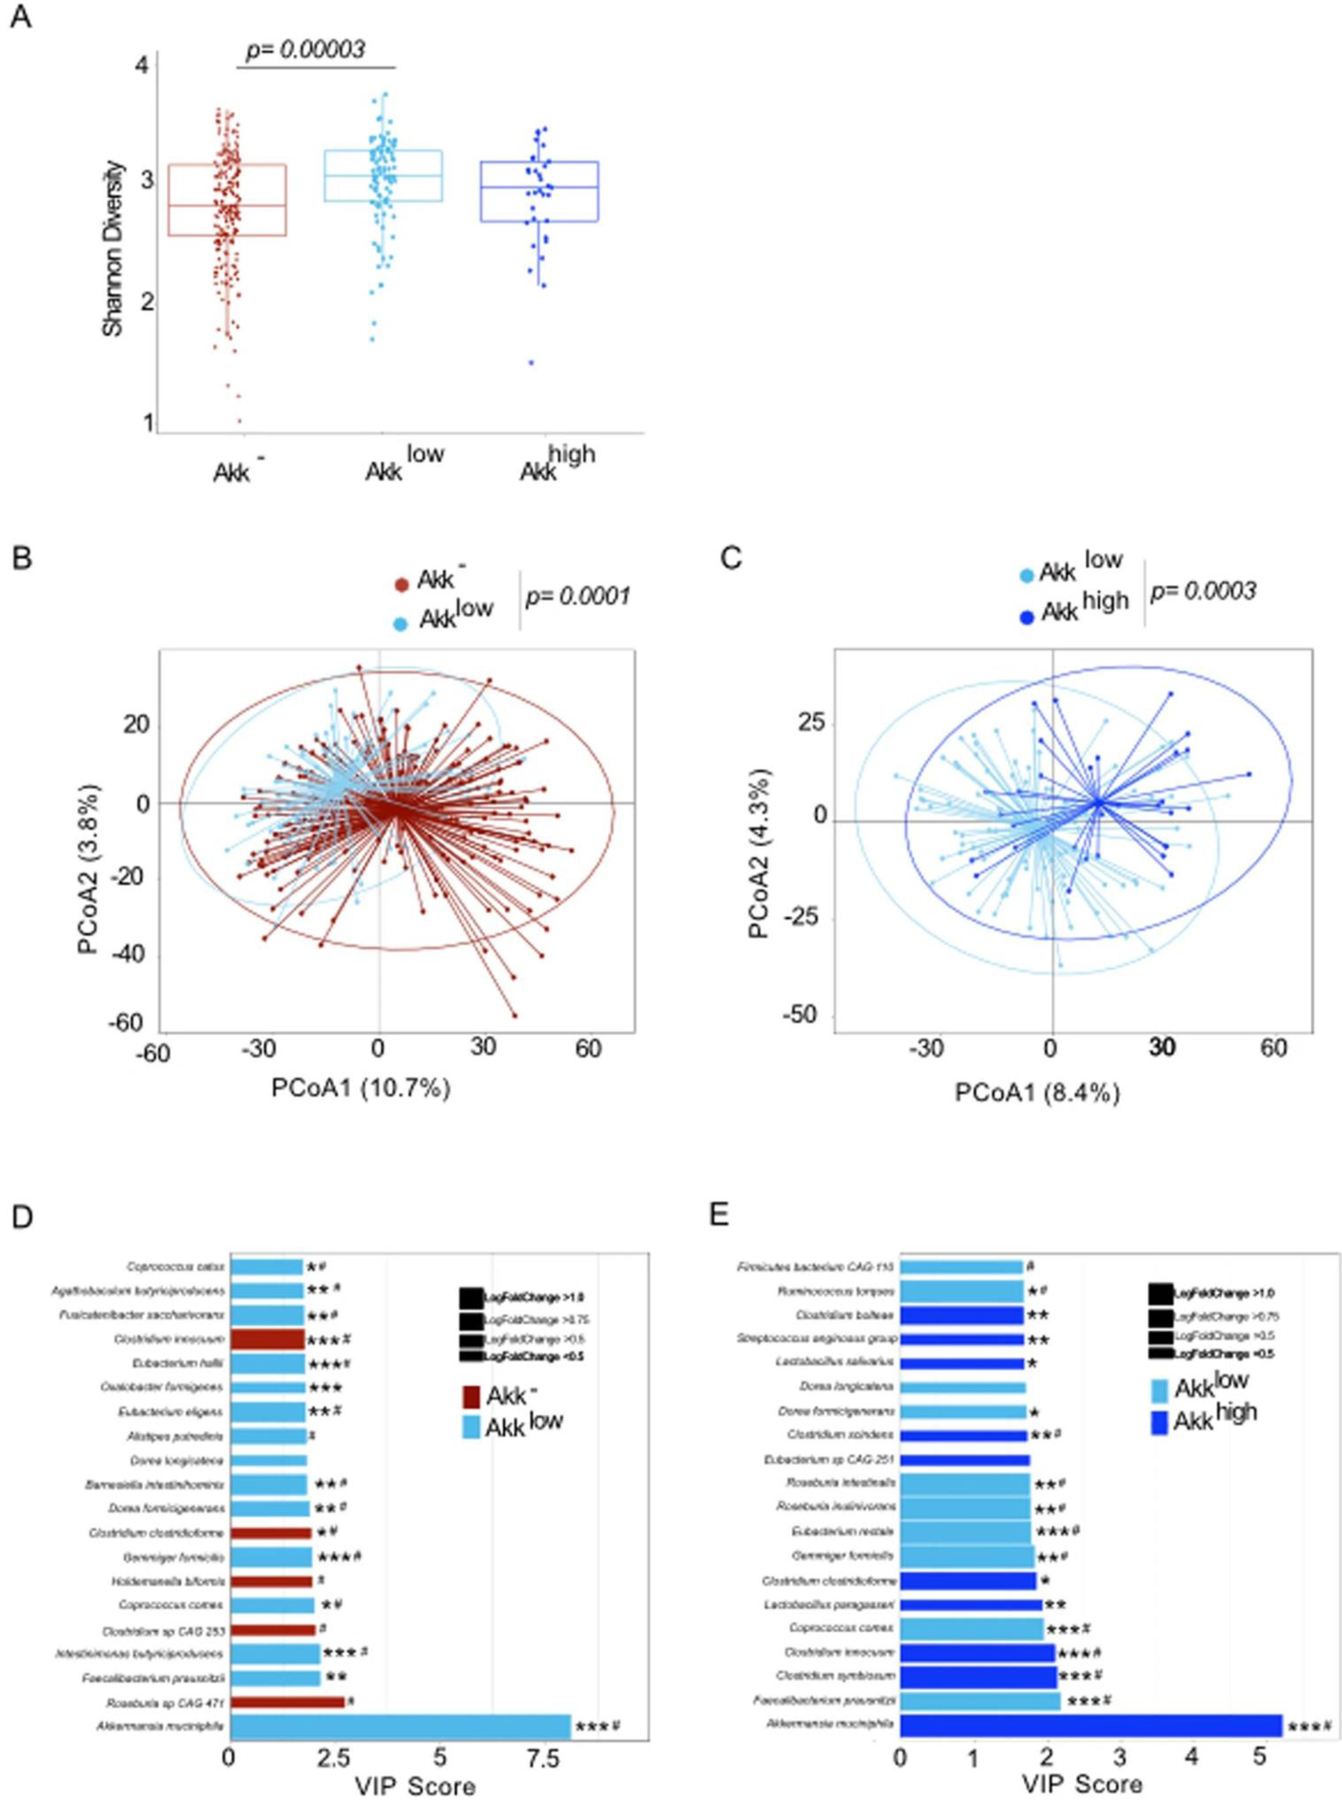
Extended Data Fig. 4:

Compositional taxonomic differences in stools of NSCLC patients segregated according to Akk relative abundance. A. Alpha diversity according to Akk relative abundance segregated in 3 groups Akk−: undetectable Akk, Akklow: A. muciniphila relative abundance between 0.035–4.799% (<77th percentile of positive samples), and Akkhigh: 4.799% (> 77th percentile) (N=338). The lower and upper hinges of boxplots correspond to the 25th and 75th percentiles, respectively. The midline is the median. The upper and lower whiskers extend from the hinges to the largest (or smallest) value no further than ×1.5 interquartile range from the hinge, defined as the distance between the 25th and 75th percentiles. P-values were calculated using a two-sided nonparametric Wilcoxon sum-rank test. B-C. Beta-diversity using PCoA between Akk− and Akklow (B) and between Akklow and Akkhigh (C) p-values were calculated using PERMANOVA with 999 permutations. The PERMANOVA test compares groups of objects and tests the null hypothesis that the centroids and dispersion of the groups are equivalent. The P-value is calculated by comparing the actual F test to that gained from (in this case 999) random permutations of the objects between the groups. If p <0.05, the null hypothesis is disregarded and we conclude that the centroids and dispersion between the groups are not equivalent. D-E. Variable importance plot (VIP) discriminant analysis of taxonomic stool composition according to Akk relative abundance, between Akk− versus Akklow (D) and Akklow versus Akkhigh (E). Differences in bacterial prevalence and abundance in fold ratios are indicated in these VIP plots. VIP: Variable importance plot. * p <0.05,** p <0.01, *** p <0.001. P-values were calculated using a two-sided nonparametric Wilcoxon sum-rank test. # Multivariate analysis (ANCOM-BC/Maaslin2) with a false discovery rate (FDR) adjusted p-value <0.2.
