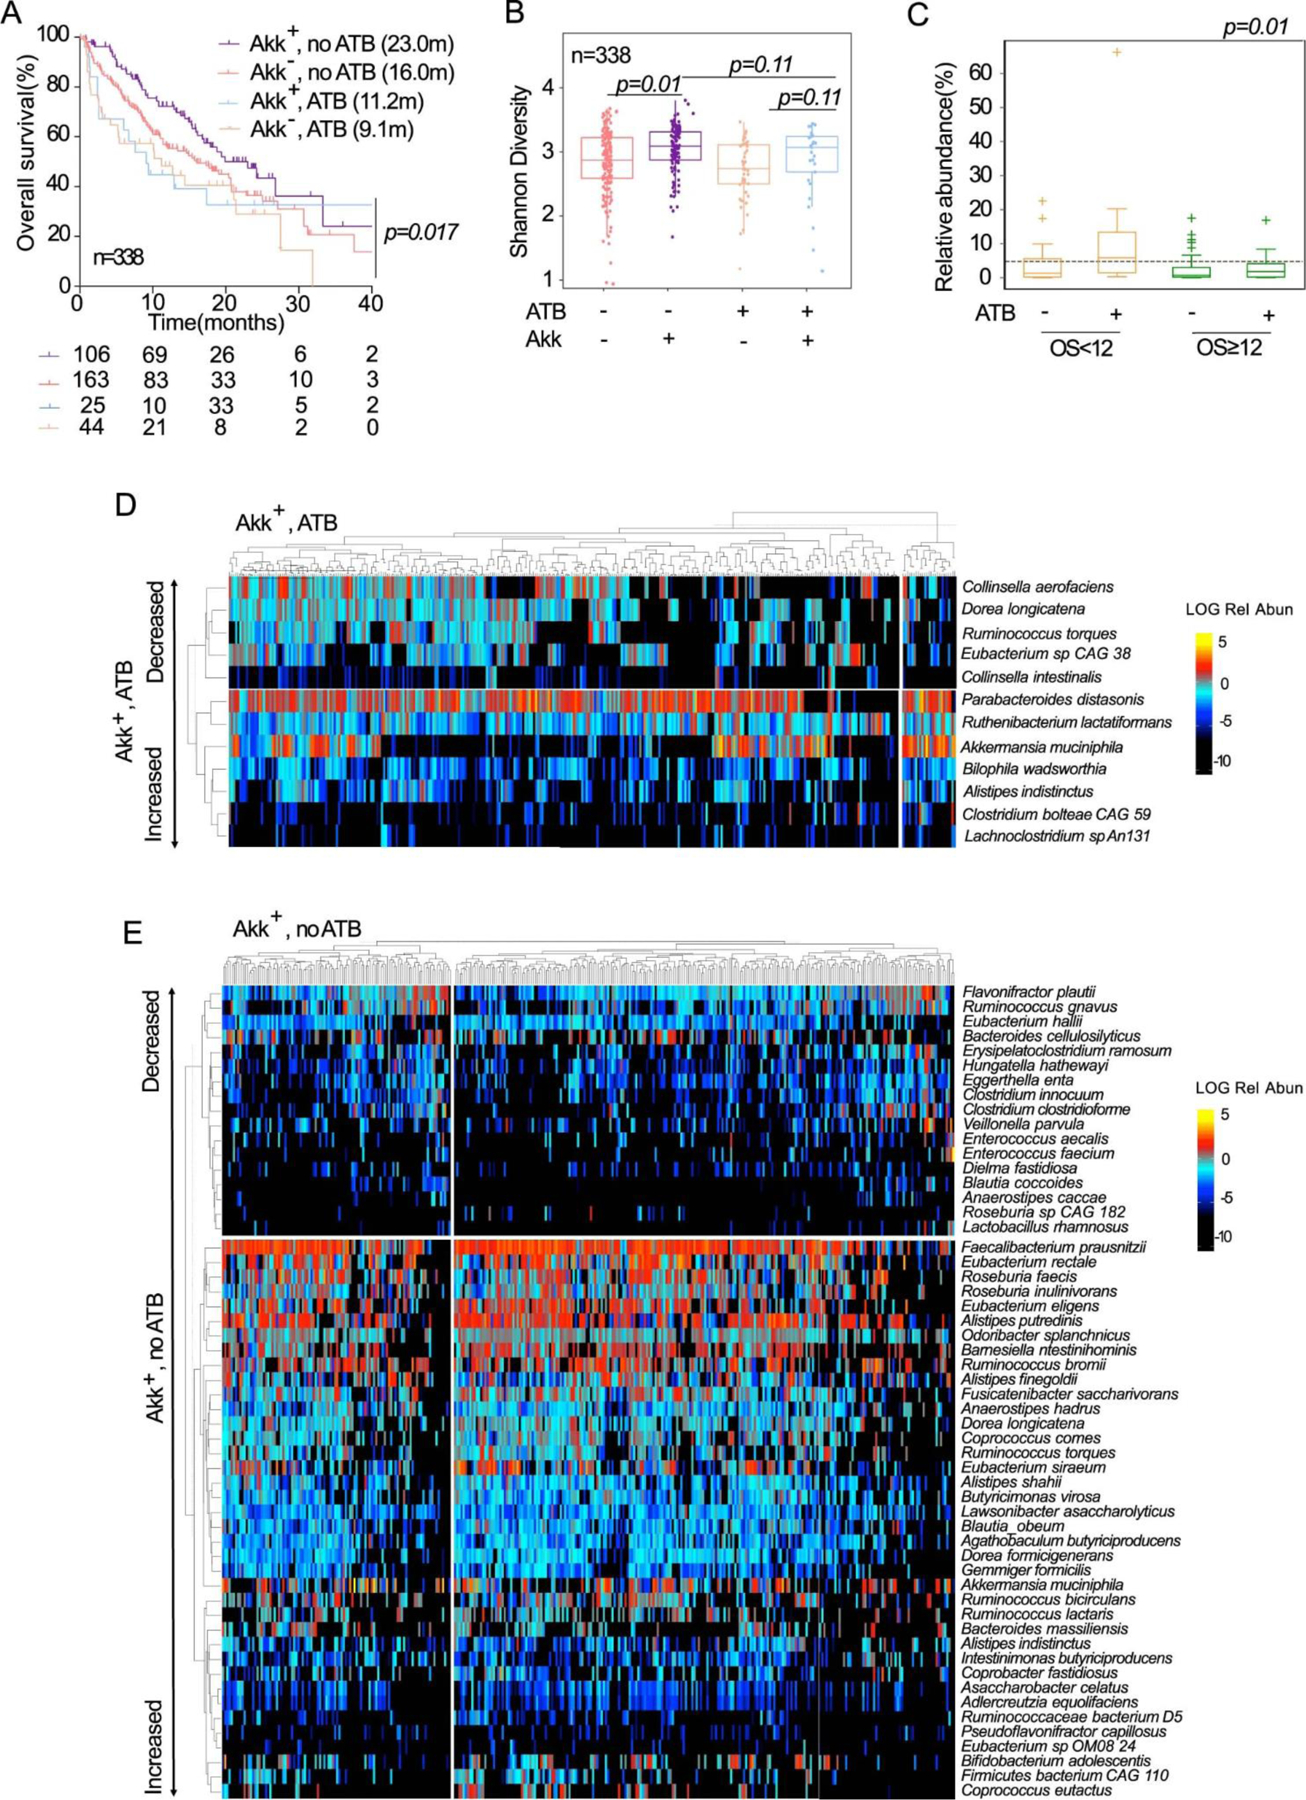
Extended Data Fig. 5:

Interaction between ATB and A.muciniphila on survival and microbiome composition. A. Kaplan-Meier curve and Cox regression analysis of overall survival in the n=338 patients according to detectable versus undetectable Akk (Akk+ and Akk−) and ATB use (noATB: no exposure to ATB, ATB: antibiotics exposure within 2 months prior to ICI initiation). The Akk status and ATB use were compared using the stratified log-rank test. P-values are one-sided with no adjustment. B. Shannon diversity index representing stool alpha diversity in Akk+ and Akk− groups of fecal specimen from patients exposed or not to ATB (N=338). The lower and upper hinges of boxplots correspond to the 25th and 75th percentiles, respectively. The midline is the median. The upper and lower whiskers extend from the hinges to the largest (or smallest) value no further than ×1.5 interquartile range from the hinge, defined as the distance between the 25th and 75th percentiles. P-values were calculated using a two-sided nonparametric Wilcoxon sum-rank test. C. Box Plots representing the relative abundance (mean+/−SEM) of Akk according to overall survival at 12 months and exposure or not to ATB in n=338 patients. The lower and upper hinges of boxplots correspond to the 25th and 75th percentiles, respectively. The midline is the median. The upper and lower whiskers extend from the hinges to the largest (or smallest) value no further than ×1.5 interquartile range from the hinge, defined as the distance between the 25th and 75th percentiles. The test used was Kruskal-Wallis, two-sided, 5% level of significance. No adjustments were made for multiple comparisons. D. Heatmap showing differentially abundant species identified in stools with detectable Akk (Akk+) in patients exposed to (D) or not exposed to (E) ATB within 2 months prior to ICI initiation. Species were identified using a non-parametric Kruskall-Wallis test comparing 4 groups made up of 2 variables: Akkermansia muciniphila presence/absence and antibiotic use. The figure shows species’ abundances across samples whose False Discovery Rate (FDR) was <0.2 in the KW test and whose Wilcoxon Rank Sum Test p-value was <0.05 when comparing the highlighted group to the rest.
