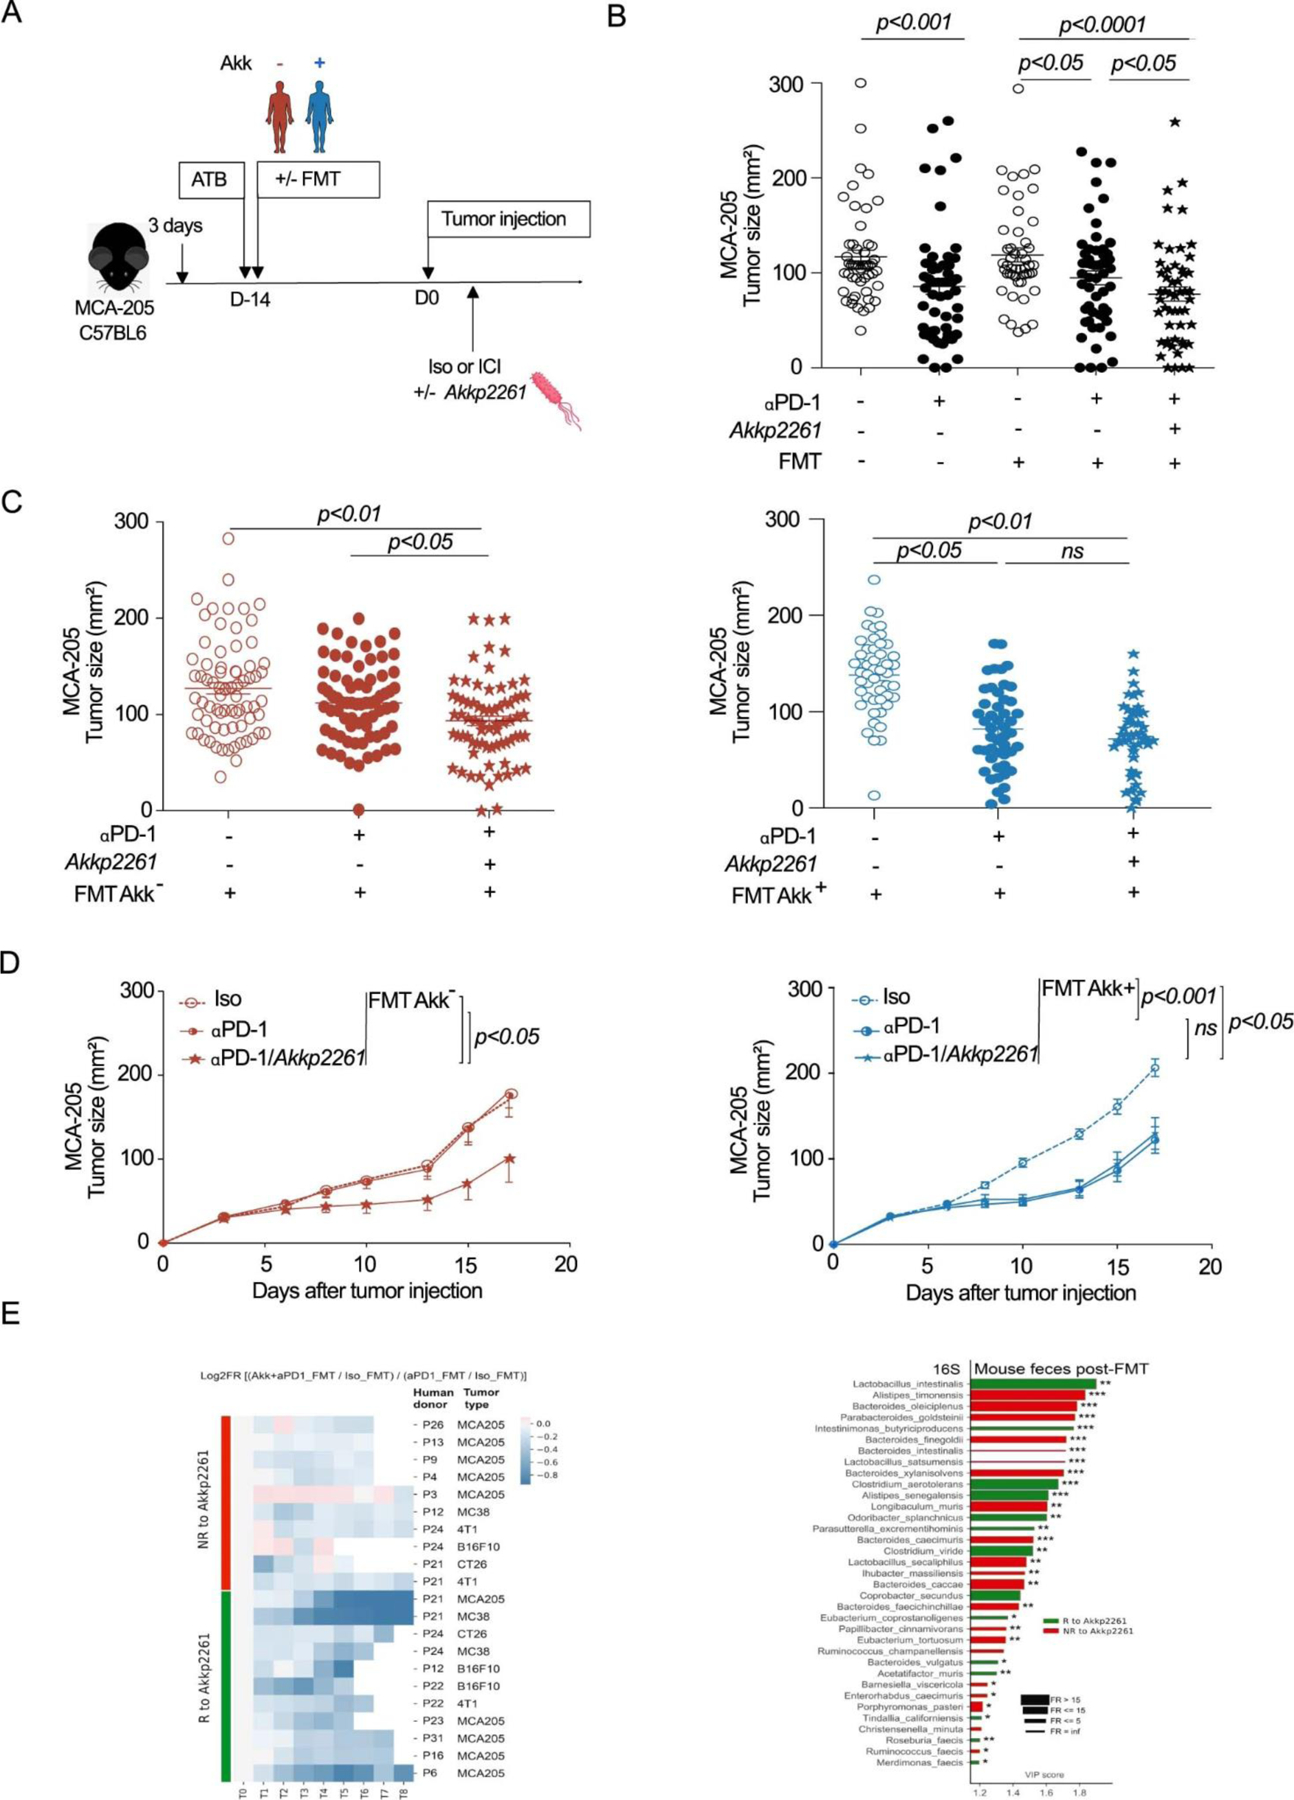
Extended Data Fig. 6:

Akkp2261 modulated the murine microbiome composition, rescuing responsiveness to PD-1 blockade. A. Experimental setting. After 3 days of ATB, FMT was performed in mice by oral gavage using patient stools classified according to Akk (Akk+ and Akk−). 14 days later, MCA-205 tumors were i.d inoculated, and mice were treated with anti-PD-1 or iso-control mAbs 4 times every 3 days concomitantly with oral supplementation of Akkp2261 four times every 3 days. B-D. Mean MCA-205 tumor sizes+/−SEM are depicted at day 12 after 4 therapeutic injections of anti-PD-1 mAbs, in each FMT groups (Akk+ and Akk−) supplemented or not with Akkp2261 as well as in animals reared in SPF conditions (FMT-). Concatenation of>25 experiments using n=53 mice in Iso group, n=51 in Iso FMT+ group, n=56 in anti-PD-1 and anti-PD-1 FMT+ groups. Each experiment comprising 6 mice/group and was performed at least 2 times for each FMT (Supplementary Table S6) (B). Tumor sizes according to FMT Akk− (C left, n=72/group; C right, n=49 in Iso group and n=48 in other groups) versus Akk+ (D left, n=6/group, D right, n=12 in Iso and anti-PD-1 groups, n=14 in anti-PD-1 with Akkp2261) are depicted, each dot representing one mouse. Statistics were mixed-effect modeling with specific software ((https://kroemerlab.shinyapps.io/TumGrowth/) for longitudinal tumor growth analysis (D) and Mann–Whitney U-test (B-C) to compare two independent groups (after Kruskal–Wallis test was implemented using Dunn’s test for multiple groups). ns=not significant. E. Clustermap of ratios of Akkp2261-related tumor reduction at day 12–15 following PD-1 mAbs in FMT normalized onto ratios obtained in SPF mice. The relative tumor size reduction follows a blue color code (the darker the greater; R, Responders)). 29 FMT were performed according to A. N=29–30 mice/group in total. Each experiment contained 6 mice/group and was performed 2–3 times for each tumor model (E, left panel). 16S rRNA sequencing of gene amplicons of stools harvested in recipient avatar tumor bearers at day 12 post-4 injections of anti-PD-1 Abs and 4 oral gavages with Akkp2261 divided into green (R) and red (NR) groups. VIP plot repartition of discriminant metagenomic species segregating groups of mice that responded to oral Akkp2261 (R, green bars) or not (NR, red bars). (E, right panel). Asterisks represent significant Mann-Whitney U test without FDR at 10%. * p <0.05, ** p <0.01, *** p <0.001. P-values were calculated using a two-sided nonparametric Wilcoxon sum-rank test. Adjustments for multiple comparisons were not made.
