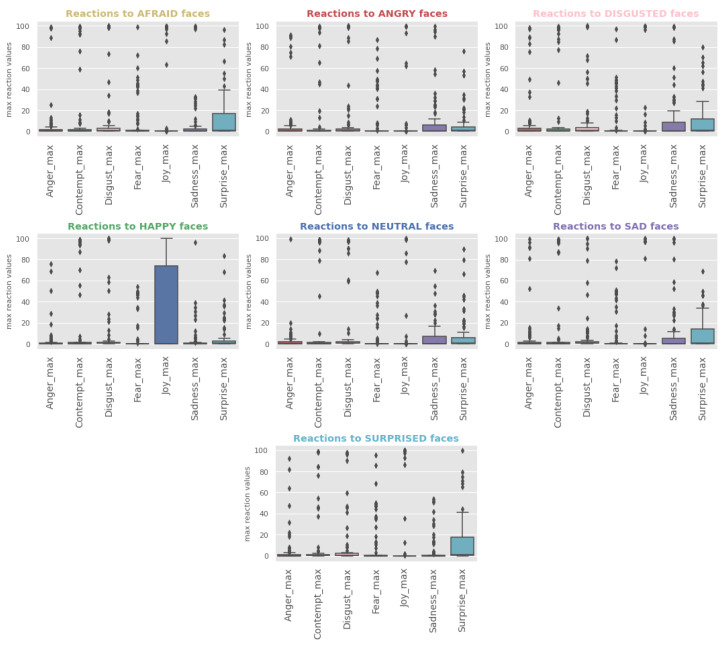
Figure 8.
Facial reactions vs. stimuli boxplots generated by considering all the maximum values for each reaction and stimulus. Each plot represents the data for one type of emotional stimuli, with x-axis representing the types of reaction and y-axis representing the maximum reaction probability scores.

