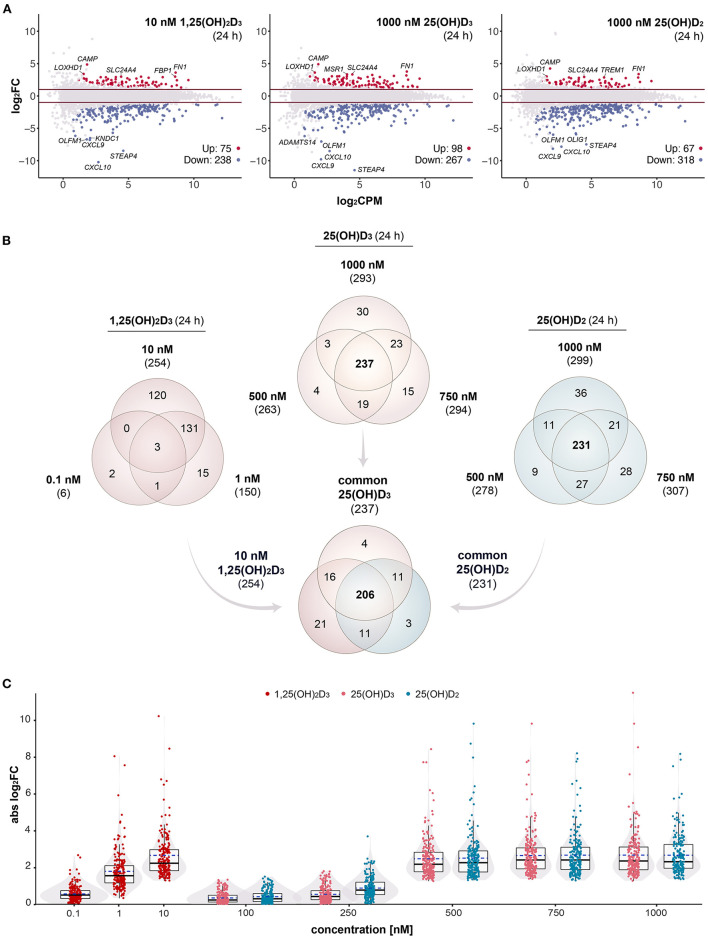
Figure 1.
Gene-regulatory potential of vitamin D metabolites. MA plots display the genome-wide transcriptional response of PBMCs treated for 24 h with 10 nM 1,25(OH)2D3, 1000 nM 25(OH)D3 or 1000 nM 25(OH)D2 in comparison to solvent (0.1% EtOH) (A). For each gene, the change of expression (log2FC) between treated and control samples is shown in relation to its mean expression level (log2CPM). Differential expression analysis was performed as a pairwise comparison per each concentration by using glmTreat test. Significantly (FDR < 0.05) up- and down-regulated genes are highlighted in red and blue, respectively. Horizonal lines (red) indicate the applied statistical testing threshold (absolute FC > 2). The top 5 responsive genes (up- and down-regulated) are labeled. Venn diagrams show the overlap of vitamin D target genes per metabolite (B). The relations between all treatments and concentrations (at 24 h) are provided in Supplementary Figure 3. Box and violin plots summarize the distribution of the magnitude of expression change (absolute log2FC) of the 206 common genes for each vitamin D metabolite and concentration (C). Solid lines within the boxes indicate medians, while dashed lines mark the mean.

