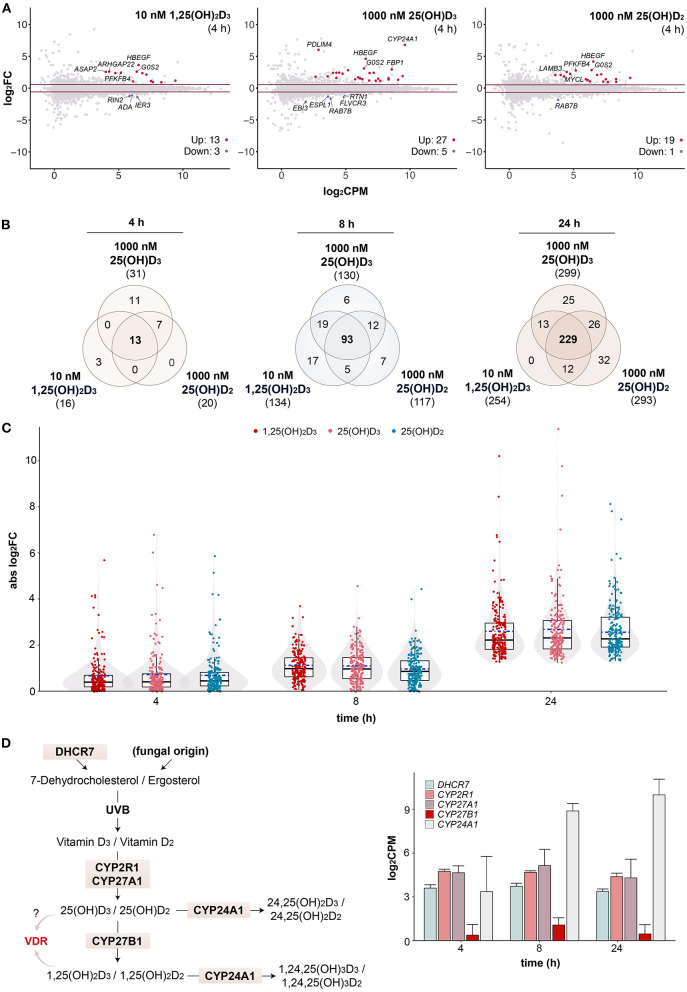
Figure 3.
Changes in transcriptional profiles over time. MA plots show early gene expression changes in PBMCs treated for 4 h with 10 nM 1,25(OH)2D3, 1000 nM 25(OH)D3 or 1000 nM 25(OH)D2 in comparison to solvent (0.1% EtOH, i.e., time-matched control) (A). For each gene, difference in expression (log2FC) between treated and control samples is shown in relation to its mean expression level (log2CPM). Genes were tested for differential expression relative to an absolute FC > 1.5 using glmTreat method. Horizonal lines (red) indicate the applied statistical testing threshold. The top 5 most responsive up- and down regulated genes (if any; FDR < 0.05) are highlighted. Venn diagrams show the overlap of vitamin D target genes per time point (B). The relations between all treatments are provided in Supplementary Figure 5. Box and violin plots summarize the distribution of the magnitude of expression change (absolute log2FC) of the 206 common genes for each vitamin D metabolite and time point (C). Solid lines within the boxes indicate medians, while dashed lines mark the mean. Please note that the data of the 24 h time point serve as a reference and are identical to those presented in Figure 1C. A map of the human vitamin D metabolism pathway marks key enzymes [(D), left]. The mean of 1,25(OH)2D3-treated and untreated mRNA expression of the five indicated genes is displayed in log2-scale as columns for all three time points [(D), right]. Error bars indicate standard deviation.

