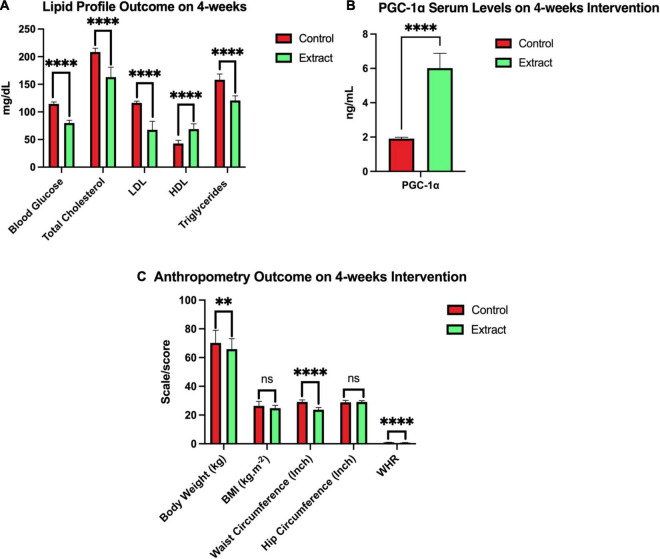
FIGURE 5.
Outcome after 4 weeks of sea grapes extract supplementation. In this figure, there were three groups (A-C). Group A showed a significant value of the lipid profile (blood glucose, total cholesterol, LDL, HDL, and triglycerides) between placebo (control) groups and extract (sea grapes antioxidant). Group B showed a significant value over the control group with the extract group 4 weeks of the intervention. Group C showed a significant value of the anthropometry profile at week 4 of the intervention between placebo or control groups and extract. nsp > 0.05; **p = 0.026; ****p < 0.0001. The above values are presented in the form of mean ± SEM.

