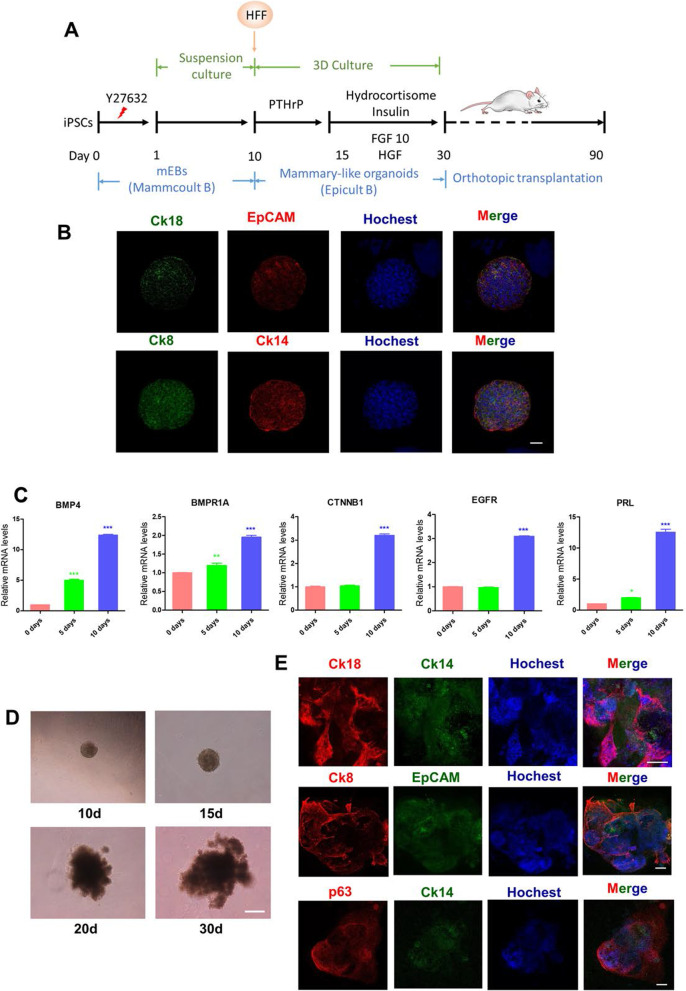
Fig. 1.
Establishing MLOs from human iPSCs. A Diagram depicting the generation of MLOs from human iPSCs using optimized media. B Immunofluorescence analysis of the expression of luminal and basal epithelial markers in 10-day mEBs. Bar, 50 μm. C RT-qPCR analysis of the expression of mammary development-related genes in mEBs from day 0 to day 10. Statistical significance was determined using one-way ANOVA with a Tukey posttest correction. RT-qPCR have been repeated at least three times. Data are depicted as mean ± SD. *p < 0.05, **p < 0.01, ***p < 0.001. D Bright-field images depicting major MLOs phenotypes from day 10 to day 30 (d: days). Bar, 50 μm. E Immunofluorescence analysis of epithelial markers in 30-day MLOs. Bar, 200 μm. All experiments have been repeated for at least twice

