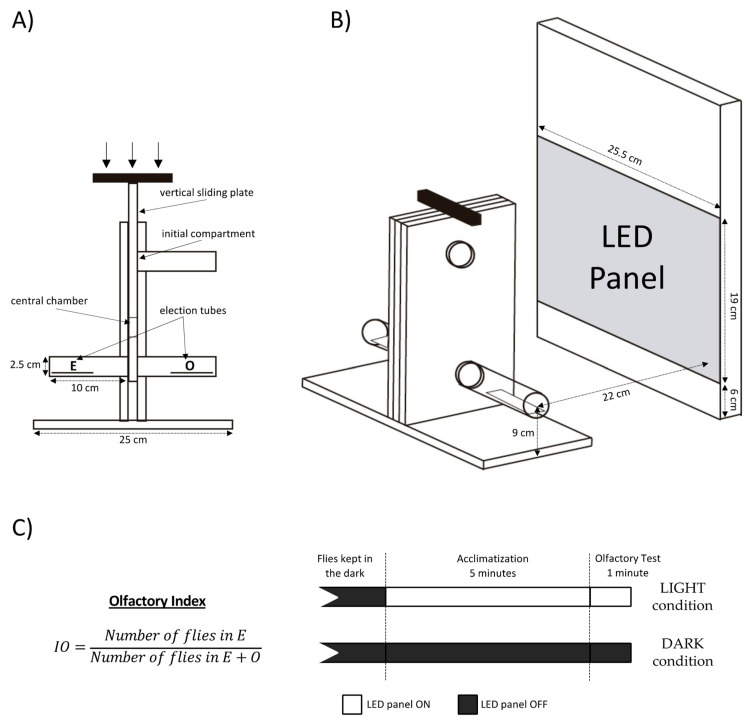
Figure 1.
Dual-light odorant-excitation olfactory setup. (A) Schematic representation of the T-maze. (B) Relative positions of the T-maze and the LED panel for the optogenetic tests. (C) Olfactory Index formula (left) and illumination conditions used in the dose–response curve of ethyl acetate (right).

